Table of Contents
Introduction
Have you ever needed to compare several group means and wondered which statistical value to trust?
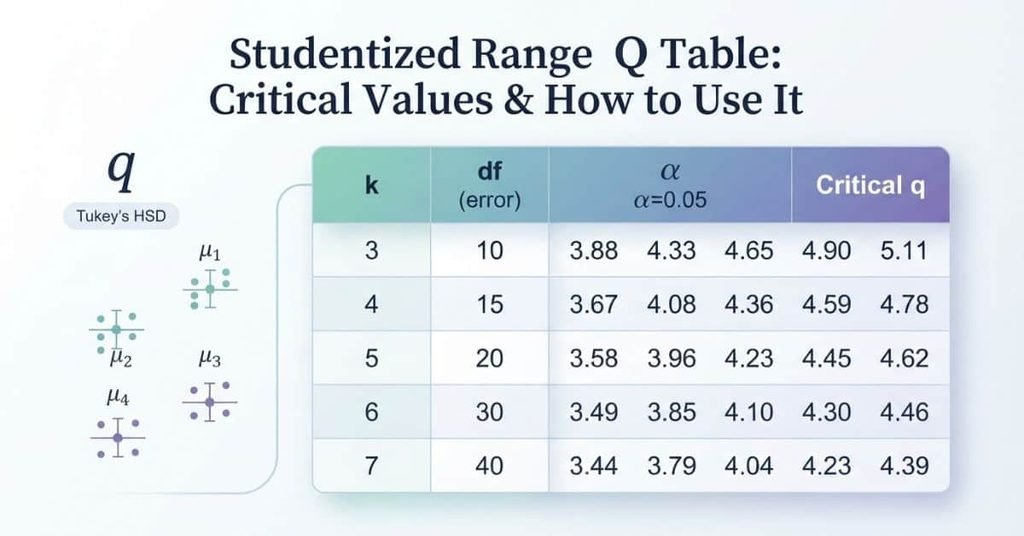
The Studentized Range Q Table helps you find critical values for comparing multiple group means. It is commonly used with post-hoc tests after ANOVA, especially Tukey’s HSD.
For beginners, the table can look confusing at first. You may see columns for the number of groups and rows for error degrees of freedom. You also need to choose the correct significance level.
This guide will make the Studentized Range Q Table easier to understand. You’ll learn what the Q statistic means and how critical Q values work.
We’ll also explain how the table connects to Tukey’s HSD test. You’ll see how to choose the correct row and column for your analysis.
By the end, you’ll know how to read the table and use its values with confidence in basic statistical comparisons.
What Is the Studentized Range Q Table?
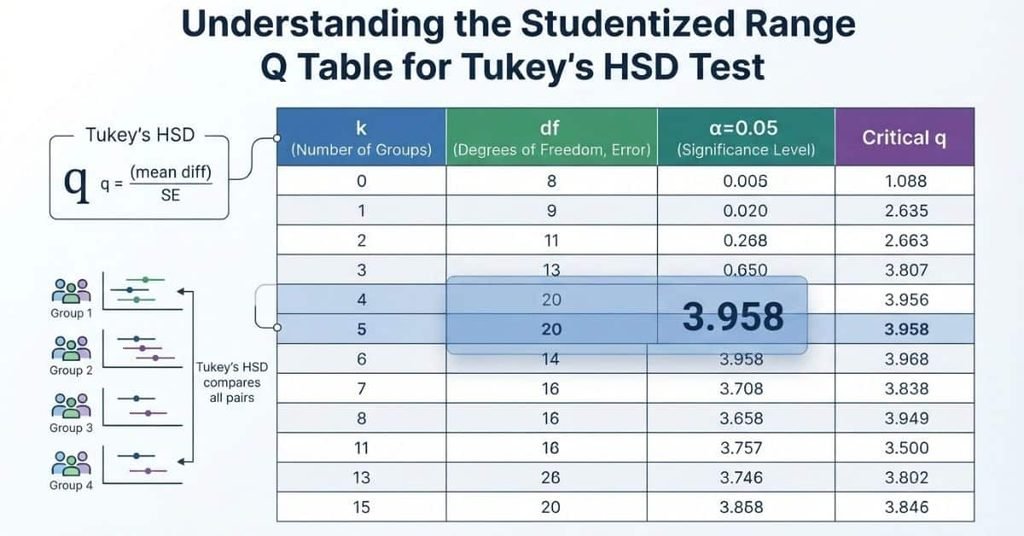
The Studentized Range Q Table is a reference table used to find critical values for comparing several group means. It comes from the Studentized range distribution, which measures the spread between sample means relative to estimated error.
The Q statistic represents the standardized range among multiple group means. A larger Q value usually indicates greater differences between the highest and lowest group means.
A critical Q value is the cutoff used to judge whether those differences are statistically significant. You compare your calculated Q statistic with this critical value.
The table depends on several key factors:
- Significance level (α): The chosen risk level for declaring a difference significant, often 0.05.
- Number of groups (k): The total groups or means being compared.
- Error degrees of freedom (df): The degrees of freedom associated with the error term from ANOVA.
You select the appropriate significance level, group count, and error degrees of freedom. Then, you find the corresponding critical Q value. This value is commonly used with Tukey’s HSD for post-hoc comparisons after ANOVA.
Studentized Range Q Table
The Studentized Range Q Table gives critical q values for comparing multiple group means. Each value depends on three main inputs: the number of groups, error degrees of freedom, and significance level.
Use the table by identifying your number of groups (k) and error degrees of freedom (df). Then, choose the appropriate significance level (α) to find the corresponding critical q value.
Q Critical Values at α = 0.05
The table below provides selected critical values for common group counts and error degrees of freedom. Values are rounded to three decimal places.
| Number of Groups (k) | Error df = 10 | df = 20 | df = 30 | df = 60 | df = 120 |
|---|---|---|---|---|---|
| 3 | 3.877 | 3.578 | 3.486 | 3.399 | 3.356 |
| 4 | 4.327 | 3.958 | 3.845 | 3.737 | 3.685 |
| 5 | 4.654 | 4.232 | 4.102 | 3.977 | 3.917 |
| 6 | 4.912 | 4.445 | 4.301 | 4.163 | 4.096 |
Table variables:
- Number of groups (k): The total number of sample means being compared.
- Error degrees of freedom (df): The error degrees of freedom from the ANOVA.
- Significance level (α): The selected probability level for the test.
- Critical q value: The cutoff value used with the Studentized range distribution.
For example, suppose you compare 4 groups with 20 error degrees of freedom at α = 0.05. Find the row where k = 4 and the column for df = 20. The critical q value is 3.958.
You can then compare this critical value with your calculated q statistic. If your calculated q exceeds the critical value, the observed range is statistically significant at the selected α level.
How to Use the Q Table
Follow these steps when reading the table:
- Determine the number of groups (k) in your analysis.
- Find the error degrees of freedom (df) from your ANOVA results.
- Select your chosen significance level (α).
- Locate the matching critical q value.
- Compare the critical q value with your calculated q statistic.
For Tukey’s HSD, the critical q value is combined with the appropriate error term and sample-size information. This helps determine whether specific differences between group means are statistically significant.
For a complete online reference, the table should be responsive, searchable, and easy to scan on mobile devices. A searchable table also helps readers quickly locate a specific combination of k, df, and α without scrolling through a large statistical table.
Pro Tip: Always confirm that your table uses the same significance level and degrees of freedom as your statistical test. Mixing values from different conditions can produce an incorrect conclusion.
What Is the Studentized Range Distribution?
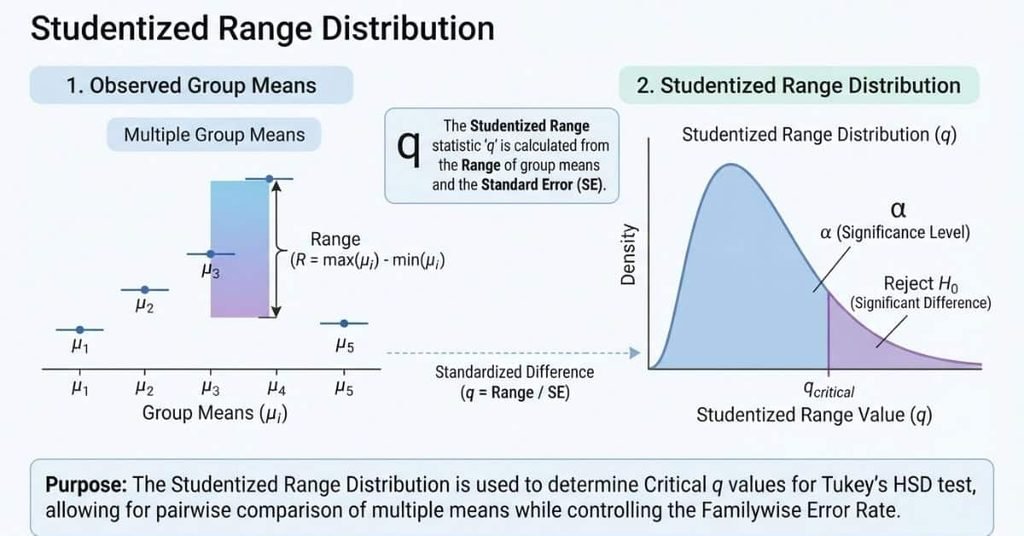
The Studentized range distribution is the statistical distribution behind the Studentized Range Q Table. It helps evaluate the spread between several sample means while accounting for random variation within the data.
This distribution is especially useful when you compare multiple group means after an ANOVA. Instead of making many separate comparisons without adjustment, methods such as Tukey’s HSD use the Studentized range to control the overall chance of finding a false difference.
The critical value changes based on the number of groups and the available degrees of freedom. As the number of groups (k) increases, there are more possible mean differences to consider. The distribution therefore uses a different cutoff to account for that wider comparison range.
The error degrees of freedom (df) also affect the critical value. Smaller df means less information for estimating error, which generally produces a larger critical value. As df increases, the estimate becomes more stable, and the critical value typically decreases.
You don’t need to understand the full mathematical distribution to use the Q table. Focus on matching your k, df, and significance level (α) with the correct critical q value.
How to Use the Studentized Range Q Table
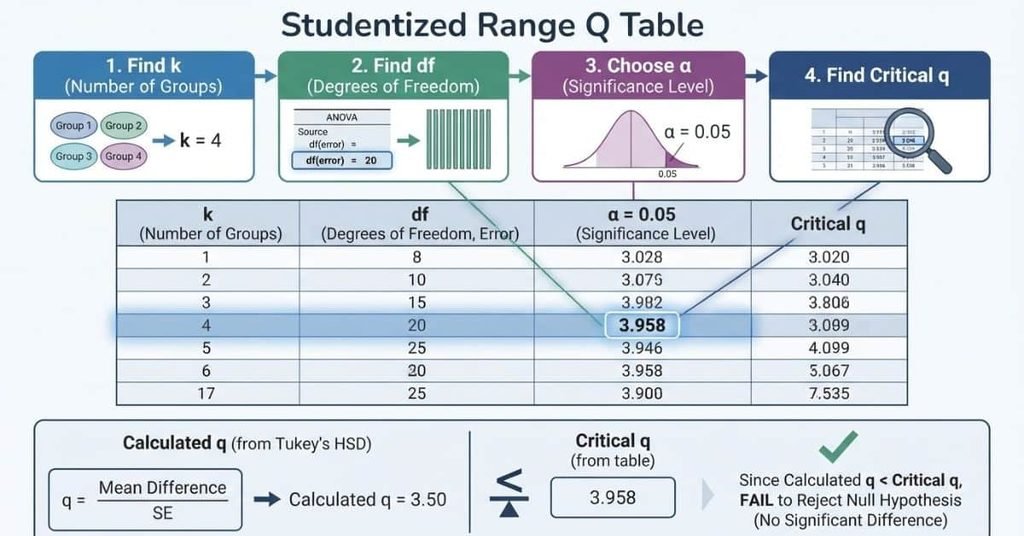
Using a Studentized Range Q Table becomes easier when you follow the same order every time. You need three key inputs: the number of groups, error degrees of freedom, and significance level.
After finding these values, locate the matching critical q value. Then compare it with your calculated q statistic to make your decision.
Step 1: Determine the Number of Groups
The number of groups, represented by k, tells you how many group means you are comparing.
For example, an experiment with four treatment groups has k = 4. If you compare six group means, then k = 6.
Count each group included in the multiple-comparison analysis. Do not count individual observations as separate groups.
Step 2: Determine the Error Degrees of Freedom
The error degrees of freedom (df) usually comes from the error term in your ANOVA results.
For a one-way ANOVA, error degrees of freedom are calculated from the total sample size and number of groups:
df = N − k
Here, N represents the total number of observations. The value k represents the number of groups.
For example, if an ANOVA contains 30 observations across 4 groups, the error degrees of freedom are 26.
Always use the error df reported by your ANOVA output when available.
Step 3: Choose the Significance Level
Next, identify the significance level (α) used for your statistical test. Common choices include:
- α = 0.05: A commonly used significance level.
- α = 0.01: A stricter significance level.
Your chosen α determines which section of the Q table you should use. Don’t select a value simply because it appears convenient.
Step 4: Locate the Correct Critical Q Value
Now combine your three inputs: k, df, and α.
Start by finding the section for your chosen significance level. Then locate the row matching your number of groups (k). Find the column matching your error degrees of freedom (df).
The value where these selections meet is your critical q value.
For example, suppose you have:
k = 4df = 20α = 0.05
Using the reference table above, the matching critical q value is 3.958.
Always check the table heading before reading the value. Different α levels produce different critical values.
Step 5: Compare the Calculated Statistic With Critical Q
Finally, compare your calculated q statistic with the critical q value.
If the calculated q is greater than the critical q, the result is statistically significant at the selected α level. This provides evidence that the observed range between the compared means is larger than expected from random variation alone.
If the calculated q is less than or equal to the critical q, the result does not meet the selected significance threshold.
The basic decision rule is:
Calculated q > Critical q → statistically significant
Calculated q ≤ Critical q → not statistically significant
When using Tukey’s HSD, apply the complete test procedure rather than treating the Q table as a standalone test. The table provides the critical value needed for the comparison.
Studentized Range Q Table Example
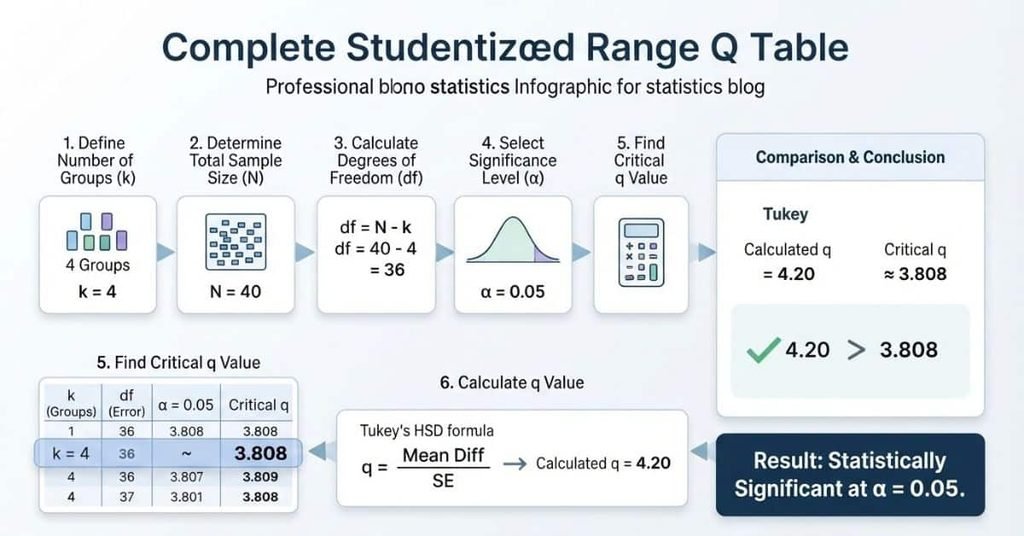
A numerical example makes the table much easier to understand. Suppose a researcher compares the mean scores of four groups after running a one-way ANOVA.
The ANOVA has 40 total observations across four groups. Therefore, the error degrees of freedom are:
df = N − k
df = 40 − 4 = 36
Suppose the researcher chooses a 5% significance level, so α = 0.05.
Now the required table inputs are:
- Number of groups (k) = 4
- Error degrees of freedom (df) = 36
- Significance level (α) = 0.05
Find the section for α = 0.05. Then locate k = 4 and df = 36. A standard Studentized range table gives a critical q value of approximately 3.808 for these settings.
Now suppose the calculated q statistic is 4.20.
Compare the two values:
Calculated q = 4.20
Critical q ≈ 3.808
Because 4.20 > 3.808, the calculated statistic exceeds the critical value. The result is therefore statistically significant at α = 0.05.
This means the observed range between the relevant group means is large enough to reject the null comparison at the selected significance level.
Note: Critical values can vary slightly because of table rounding. Always use the table that matches your statistical method and assumptions.
Quick Example Summary
| Step | Value |
|---|---|
| Number of groups (k) | 4 |
| Total observations (N) | 40 |
| Error degrees of freedom (df) | 36 |
| Significance level (α) | 0.05 |
| Critical q | ≈ 3.808 |
| Calculated q | 4.20 |
| Decision | Significant |
This five-step process is the key to using a Q table correctly: identify k, find df, choose α, locate critical q, and compare the calculated statistic.
Studentized Range Q Table for Tukey’s HSD
The Studentized Range Q Table has a direct connection to Tukey’s HSD. Tukey’s HSD uses the Studentized range distribution to determine how large a difference between group means must be before it is considered statistically significant.
A common analysis follows this general path:
ANOVA → F test → multiple comparisons → Tukey’s HSD → Studentized range critical q
First, researchers use ANOVA to test whether several group means differ overall. If the ANOVA F test is significant, researchers often follow it with multiple comparisons to identify which groups differ.
Tukey’s HSD is one commonly used post-hoc method for these pairwise comparisons. It accounts for the fact that comparing many groups creates more opportunities for false-positive findings.
The Studentized range distribution provides the critical q value needed by Tukey’s method. The selected q value depends on the number of groups, error degrees of freedom, and significance level.
For equal-sized groups, Tukey’s HSD can be expressed as:
HSD = q × √(MSE / n)
Here, q is the critical value from the Studentized range distribution. MSE is the ANOVA mean square error, and n is the number of observations in each group.
You then compare the absolute difference between two group means with the HSD value. If that difference exceeds HSD, the pairwise difference is statistically significant.
Where the Critical Q Fits
The critical q value is not the final answer by itself. It is an essential input in the Tukey HSD calculation.
For example, suppose your analysis produces:
- Critical q = 3.808
- MSE = 64
- Equal group size = 10
Then:
HSD = 3.808 × √(64 / 10)
HSD ≈ 9.62
A pair of group means would need an absolute difference greater than about 9.62 to meet this Tukey HSD criterion.
One important point is that a significant ANOVA F test is a common reason to proceed to post-hoc comparisons. However, Tukey HSD does not mathematically require a significant omnibus F test in every analysis plan. Follow the testing strategy specified for your study.
The key idea is simple: ANOVA tells you whether group differences exist overall, while Tukey HSD helps identify which group pairs differ. The Studentized range Q value supplies the critical threshold for those comparisons.
How the Studentized Range Q Value Is Used in Tukey’s HSD
The critical q value is an important part of Tukey’s HSD procedure. It sets the threshold for deciding whether a difference between two group means is large enough to be statistically significant.
The process is easier to understand conceptually than mathematically:
Critical q → standard error → HSD threshold → compare group means
For equal-sized groups, the basic Tukey HSD relationship can be represented as:
HSD = q × √(MSE / n)
Each part has a specific role:
- q critical: The critical value taken from the Studentized range distribution.
- Mean square error (MSE): The ANOVA estimate of variation within the groups.
- Sample size (n): The number of observations in each group when group sizes are equal.
- Standard error: Represents the estimated uncertainty around differences between group means.
- Difference between group means: The observed distance between two group averages.
After calculating the HSD threshold, compare it with the absolute difference between two group means. If the difference exceeds the HSD value, that comparison meets the selected Tukey significance criterion.
The main idea is simple: q helps turn the ANOVA error estimate into a threshold for comparing group means.
Studentized Range Q Table vs. Tukey HSD Table
Students often search for both a Studentized Range Q Table and a Tukey HSD Table. These terms are closely related, but they don’t describe exactly the same thing.
| Resource | Purpose |
|---|---|
| Studentized Range Q Table | Provides critical q values from the Studentized range distribution. |
| Tukey HSD | Uses the Studentized range distribution for multiple comparisons between group means. |
A Q table is mainly a reference tool. You use it to find the critical q value based on factors such as k, df, and α.
Tukey’s HSD is the statistical procedure that uses that critical value. It combines q with the ANOVA error estimate and sample-size information.
This distinction matters when reading statistics guides or software output. A source may call its reference chart a Tukey HSD table, even though the underlying values come from the Studentized range distribution.
So, when you see either term, check what the table actually provides. If it lists critical q values, you’re working with Studentized range critical values.
Understanding the Variables in the Q Table
Reading a Q table becomes much easier when you know what each symbol represents. Four variables appear repeatedly: k, df, α, and q.
What Is k?
k represents the number of groups or means being compared.
For example, comparing the means of three groups gives you k = 3. Comparing five groups gives you k = 5.
Use the total number of groups involved in the multiple-comparison procedure. Do not confuse k with the total number of observations.
The value of k matters because more groups create a wider range of possible mean differences. Therefore, the critical q value can change as k increases.
What Is df?
df means error degrees of freedom.
In an ANOVA, this value comes from the error or within-group variation. For a basic one-way ANOVA, it is commonly calculated as:
df = N − k
Here, N is the total number of observations, while k is the number of groups.
When using statistical software, use the error degrees of freedom reported in the ANOVA output.
What Is α?
α (alpha) represents the significance level selected for the statistical test.
Common choices include 0.05 and 0.01. A smaller alpha represents a stricter threshold for statistical significance.
Your selected α determines which set of critical q values you should use. Always make sure the table matches the significance level used in your analysis.
What Is q?
q represents the Studentized range statistic. In a Q table, you will usually look for the critical q value.
The critical q acts as a cutoff for the selected k, df, and α. Your calculated q can then be compared with this critical value.
If the calculated q exceeds the critical q, the observed range meets the selected statistical significance criterion.
Common Mistakes When Using the Studentized Range Q Table
The Studentized Range Q Table is useful, but small reading errors can lead to the wrong critical value. Most mistakes happen when students select the wrong table inputs or confuse related statistical terms.
Using the Wrong Number of Groups
The number of groups is represented by k. It refers to the number of group means included in the multiple-comparison analysis.
For example, comparing four treatment groups means k = 4. Don’t use the total number of observations as k.
Using the wrong k can lead you to the wrong row and critical q value.
Using the Wrong Degrees of Freedom
The table also requires the correct error degrees of freedom (df). In ANOVA, this usually comes from the error term.
Don’t automatically use the total sample size as df. Check your ANOVA output and use the reported error degrees of freedom.
For a basic one-way ANOVA, you can calculate it as:
df = N − k
where N is the total number of observations.
Choosing the Wrong α
Your significance level (α) determines which critical values you should use. Common choices include 0.05 and 0.01.
Make sure the table section matches your selected α. Using a 0.05 value when your analysis requires 0.01 can change the conclusion.
Confusing q Statistic With q Critical Value
The calculated q statistic comes from your sample data. The critical q value comes from the Studentized range table.
These values serve different purposes. You compare the calculated statistic against the critical value.
If the calculated q exceeds the critical q, the result meets the selected significance criterion.
Confusing Tukey HSD With the Q Table
Tukey’s HSD is a multiple-comparison procedure. The Q table is a reference table containing critical values from the Studentized range distribution.
They work together, but they aren’t the same thing. Tukey’s HSD uses the critical q value as part of its calculation.
Reading the Wrong Row or Column
Tables can become difficult to scan when several group counts and df values appear together. Always identify α first, then find your k and df values.
If your exact df isn’t listed, don’t simply choose a nearby value without checking the table’s instructions. Some statistical tables provide specific handling for intermediate degrees of freedom.
Pro Tip: Write down k, df, and α before opening the table. This simple step reduces lookup mistakes.
Studentized Range Q Table in Excel
Excel can help students organize and work with Studentized Range Q Table Excel data. It is especially useful when you need a clean, searchable reference table for repeated assignments or coursework.
You can create a simple worksheet with columns for:
- Significance level (α)
- Number of groups (k)
- Error degrees of freedom (df)
- Critical q value
For example, each row can represent one combination of k, df, and α. Excel’s filtering and sorting features can then help you find specific values quickly.
Excel is also useful for performing calculations around a Tukey HSD analysis. You can enter group means, sample sizes, MSE, and critical q values into separate cells. Formulas can then calculate the HSD threshold and compare group-mean differences.
However, Excel isn’t always the best choice for the complete statistical analysis. Specialized statistical software can handle ANOVA, post-hoc tests, unequal sample sizes, and other analysis requirements more efficiently.
For a simple class exercise, an organized Excel table may be enough. For a larger or more complex analysis, use software designed for statistical testing.
Studentized Range Q Table Calculator
A studentized range q table calculator can make critical-value lookups faster. Instead of manually scanning several rows and columns, a calculator can use your selected inputs to return the appropriate q value.
A useful tool would typically ask for:
- Number of groups (k)
- Error degrees of freedom (df)
- Significance level (α)
It could then display the corresponding critical q value and explain how that value is used.
A calculator can be helpful when you need a quick lookup or want to reduce table-reading errors. However, it should support your statistical method rather than replace your understanding of the analysis.
If a dedicated calculator is added to this site later, this section can naturally link to it as a practical tool.
Studentized Range Q Table PDF
A studentized range q table PDF can be useful when you want a printable reference for homework, coursework, or offline study.
A print-friendly version of the Q table should clearly show the significance level, number of groups, error degrees of freedom, and critical q values. It should also remain readable when printed on standard paper.
A PDF works best as a quick reference rather than a replacement for the explanation on this page. Readers should still understand which k, df, and α values they need before using the table.
A downloadable or print-friendly version of the table can be provided here if a complete reference table is available. This keeps the resource useful without creating a separate PDF-focused article.
Conclusion
The Studentized Range Q Table becomes much easier once you understand its key inputs. We covered how k, df, α, and critical q work together in multiple comparisons.
You also learned how the table connects with Tukey’s HSD and how to compare a calculated q statistic with its critical value. Avoiding common lookup mistakes can help you make more reliable statistical decisions.
For beginners, the key is to slow down and verify each table input. Always match the number of groups, error degrees of freedom, and significance level correctly.
Ready to apply what you learned? Explore more statistics resources and practical calculators on the website. You can also share your experience using Q tables in the comments.
Frequently Asked Questions
A Studentized Range Q Table provides critical q values for comparing multiple group means. The table uses the number of groups (k), error degrees of freedom (df), and significance level (α). It commonly supports multiple-comparison procedures such as Tukey’s HSD. You find the critical q value by matching these inputs in the table. Then, you compare the critical value with your calculated q statistic to help determine whether a difference between group means is statistically significant.
The q value represents a statistic based on the range of sample means relative to an estimate of error. A Q table usually provides critical q values, not the calculated statistic from your data. The critical q value acts as a cutoff for a chosen significance level. In Tukey’s HSD, this value helps determine how large a difference between group means must be before it is considered statistically significant.
First, identify the number of groups (k) in your comparison. Next, find the error degrees of freedom (df) from your analysis and choose the significance level (α). Locate the matching combination in the Q table to find the critical q value. Finally, compare your calculated q with the critical value. If the calculated q exceeds the critical q, the comparison is statistically significant at the selected significance level.
In a Studentized Range Q Table, k represents the number of groups or means being compared. df represents the error degrees of freedom used by the analysis. For a one-way ANOVA, this is often calculated as N − k. The symbol α represents the significance level, such as 0.05 or 0.01. You need all three values to select the appropriate critical q value from the table.
Tukey’s HSD uses the Studentized range distribution to control comparisons among multiple group means. The critical q value from the appropriate table can be used in the HSD formula for equal group sizes: HSD = q × √(MSE / n). Here, MSE is the mean square error and n is the group sample size. You then compare the absolute difference between two means with the HSD value.
A Studentized Range Q Table is a reference table containing critical q values from the Studentized range distribution. Tukey’s HSD is a statistical multiple-comparison procedure that uses this distribution. Some resources call their critical-value reference a Tukey HSD table because it supports the Tukey procedure. Always check the table headings to confirm which values and significance levels it provides.
Yes. You can organize Studentized Range Q Table values in Excel and filter them by α, k, and df to find a critical q value. Excel can also help calculate group means, sample sizes, and other values used in Tukey’s HSD calculations. For complete statistical testing, specialized statistical software may provide more direct support. Always verify that the critical values match your selected significance level and degrees of freedom.

Team ClassRank builds smart, student-friendly calculators to make grade and rank tracking simple and accurate. For questions or feedback, contact us at classrankcalculator@gmail.com.