
Introduction
Wonder why grouped data shows gaps between classes?
Class boundaries are the true limits of a class interval in statistics. They remove gaps between consecutive classes and make data continuous and accurate. This simple idea plays a big role when working with grouped data, especially in U.S. classrooms and exams.
Many beginners confuse class limits with actual data ranges. That confusion can lead to wrong graphs or misleading results. Understanding the class boundaries definition helps you avoid these mistakes and improves your data analysis skills.
In this guide, you’ll learn the class boundary meaning, see clear examples, and understand how they work step by step. By the end, you’ll feel confident using class boundaries in tables, graphs, and real problems.
“🚀 Want instant results? Try our Class Boundaries Calculator above and calculate accurate boundaries in seconds—no manual work required!”
Class Boundaries Definition (Simple Explanation)
Class boundaries show the true start and end of a class interval. They define the full range without gaps.
To define class boundaries, adjust class limits slightly. This removes gaps and makes data continuous.
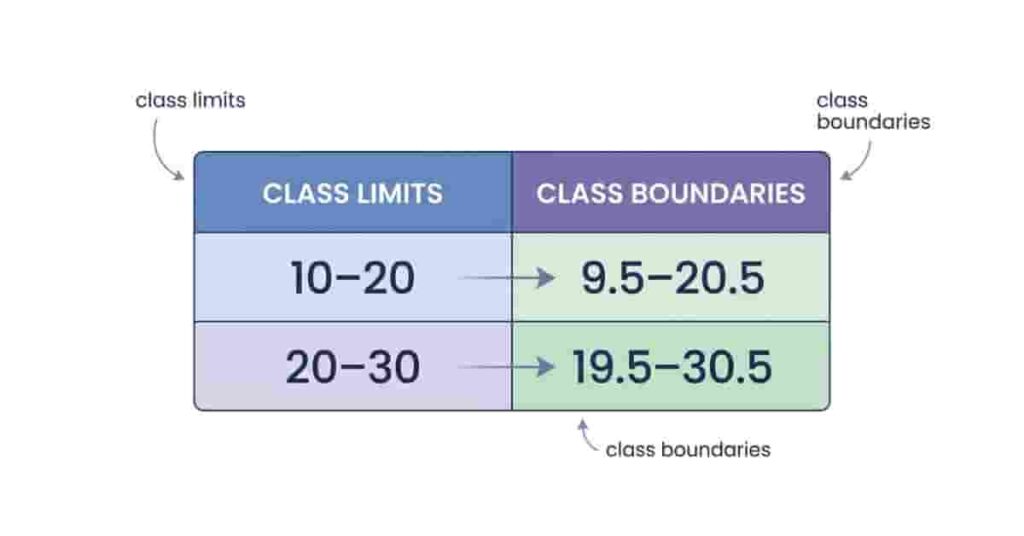
For example, a class of 10–20 may include values slightly outside these limits. So, boundaries are 9.5–20.5. This approach is used in exams and schools.
This concept helps you read grouped data and prepare for graphs like histograms.
“If you want to apply this concept, follow this step-by-step guide to find class boundaries easily.”
Pro Tips
- Adjust both lower and upper limits by the same amount.
- Apply boundaries when creating histograms or frequency graphs.
- Limits are visible; boundaries are the true data ranges.
Example of Class Boundaries
Here’s a simple example to understand how class boundaries work in real data:
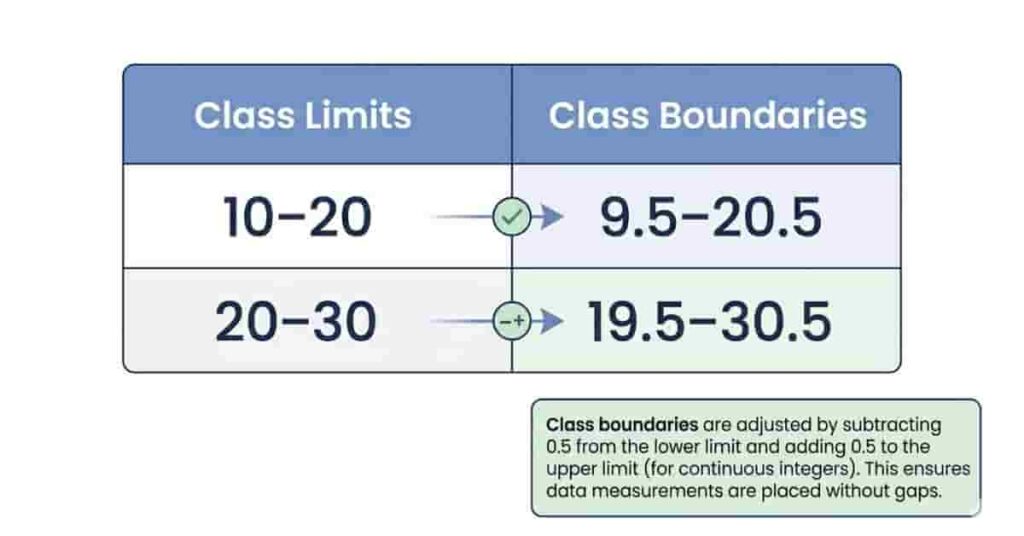
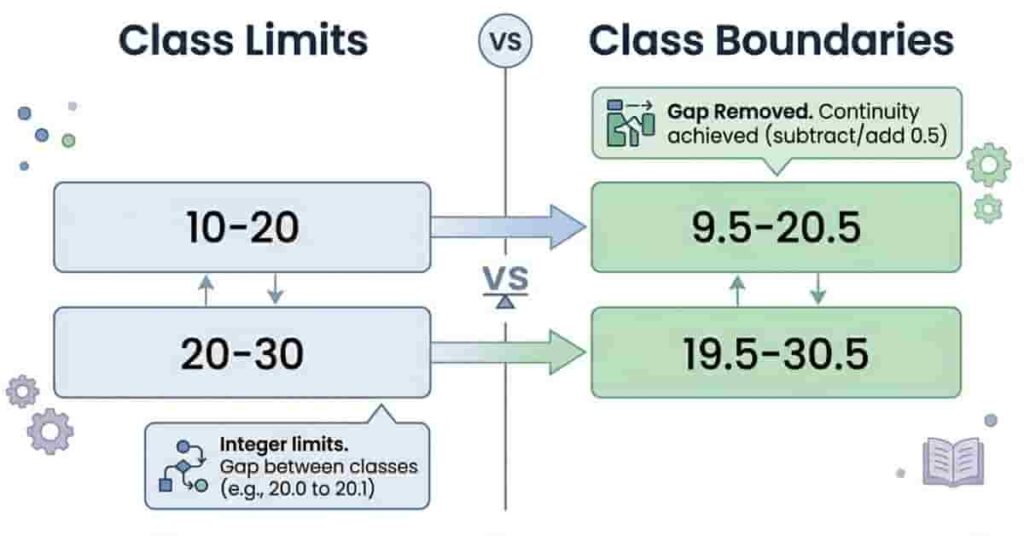
| 10 – 20 | 9.5 – 20.5 |
| 20 – 30 | 19.5 – 30.5 |
In this example, each class limit is slightly adjusted to remove gaps between intervals. The lower limit decreases by 0.5, and the upper limit increases by 0.5.
This method ensures that values like 20 are not left out between classes. As a result, the data becomes continuous and ready for accurate graphs like histograms.
How Class Boundaries Work
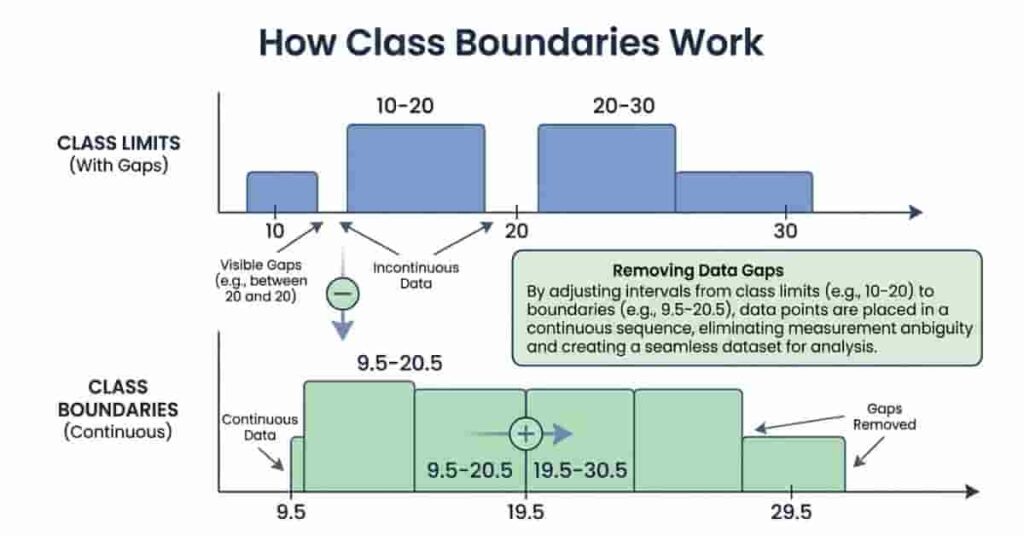
Class boundaries help by smoothly connecting class intervals, making sure there’s no gap, so every value fits right into place.
Let’s take an example: Without boundaries, there could be a confusing gap at 20—where does it belong? With boundaries, that problem disappears, and every value finds its proper spot.
This makes your grouped data continuous, which is great for analysis and helps ensure you won’t miss or misplace values.
Class boundaries really shine when you’re creating histograms. These graphs need data to flow smoothly so your bar lines up perfectly, without any confusing spaces.
Pro Tips
- Always turn your class limits into boundaries before you start graphing. It’s a simple step that pays off!
- Using boundaries means you won’t miss or overlap any values.
- Take a moment to double-check your intervals so your data always stays consistent.
Takeaways
- Class boundaries remove gaps between intervals.
- They also improve accuracy in graphs like histograms.
- They improve accuracy in graphs like histograms.
Why Are Class Boundaries Important?
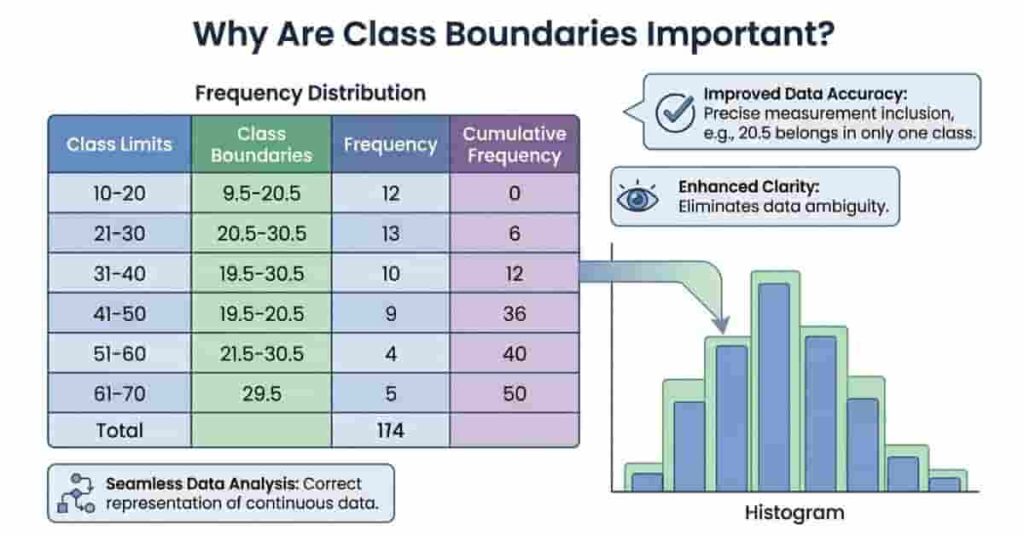
Have you ever wondered why class boundaries matter in data organization? Class boundaries make your data clear and reliable, ensuring every value fits into the correct class.
Improve Data Accuracy
Have you noticed gaps between intervals when using class limits? These may cause values to be missed or wrongly grouped. Class boundaries fix this by adjusting the limits so every value has a proper place.
As a result, results become more accurate, whether in exam contexts or during the analysis of real-world data.
Essential for Statistical Analysis
Why do statisticians use class boundaries so widely? Many formulas and methods assume that data is continuous. Without boundaries, could your analysis become less precise?
To define class boundaries correctly in statistics, treat them as the true limits for each class.
Used in Frequency Distributions
How do class boundaries help in frequency distribution tables? They organize data smoothly and ensure that each data point belongs to only one class.
Creating graphs like histograms becomes much easier and more accurate with class boundaries, since they ensure continuous data for correct visualization.
Pro Tips
- Always use class boundaries when preparing grouped data.
- Double-check intervals to avoid overlap or gaps.
- Use boundaries before creating frequency tables or graphs.
Takeaways
- Class boundaries boost data accuracy.
- They are essential for statistical analysis.
- By using class boundaries, you not only create clear and accurate frequency distributions but also lay the foundation for reliable data analysis and meaningful results.
Class Boundaries vs Class Limits
Many beginners confuse class limits with class boundaries. Both are related, but they serve different purposes in statistics.
Class limits are the numbers you see in a class, like 10–20 or 20–30. They show basic ranges but may leave small gaps between classes.
Class boundaries are the real edges of the classes. They slightly widen the limits so there are no gaps, making sure each data point goes in one class.
In short, class limits show the range, while class boundaries show the real coverage of that range.
Ready to master these concepts? Access the full guide on class limits vs class boundaries now.
“To avoid confusion, learn the difference between class limits and class boundaries clearly.”
Pro Tips
- Use class limits for basic tables and quick reference.
- Use class boundaries for graphs and accurate analysis.
- Always convert limits to boundaries before drawing histograms.
How to Calculate Class Boundaries
Calculating class boundaries is easy! You just need to make small tweaks to the class limits, which removes any gaps and helps create a continuous data set.
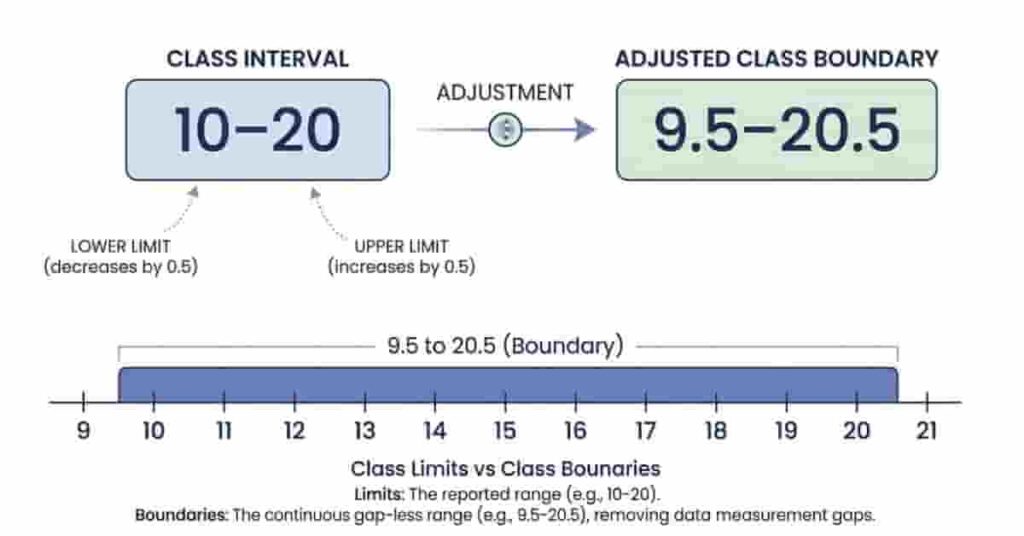
To calculate class boundaries, start by subtracting 0.5 from the lower limit.
- Next, add 0.5 to the upper limit.
For example, suppose your class is 10–20. After applying these adjustments, the class becomes 9.5–20.5. This ensures the data is continuous and ready for accurate analysis or graphing.
Takeaways
- Just subtract 0.5 from the lower limit, and add 0.5 to the upper limit—easy!
- With boundaries in place, your data flows smoothly and continuously.
- Try this quick method—it helps keep your graphs and tables accurate and error-free!
Use a Class Boundaries Calculator
Calculating class boundaries by hand is often tedious and can lead to mistakes. Using a Class Boundaries Calculator makes the process instant and helps you avoid errors.
You only need a few inputs to receive accurate boundaries for all your classes. This tool supports continuous data and saves you time, especially when working with large datasets or creating graphs like histograms.
A calculator also helps you avoid common mistakes, such as placing values incorrectly or missing out on adjusting both limits. It’s a great option for students, teachers, and anyone working with grouped data.
Act now—use our Class Boundaries Calculator for reliable, fast results. Experience accurate boundaries instantly and eliminate manual guesswork.
Pro Tips
- Enter all class limits carefully for best results.
- Double-check the calculator output before plotting graphs.
- Use it alongside your frequency tables for efficient analysis.
conclusion
In this article, we explored what class boundaries are, why they matter, and how to calculate them. We covered clear examples, differences from class limits, and their importance in graphs and frequency distributions. By understanding the definition of class boundaries, beginners can organize data accurately and avoid common mistakes.
Using class boundaries ensures continuous, precise data, which is essential for correct analysis and creating accurate histograms. You now know how to adjust class limits, apply boundaries, and even use a calculator for instant results.
👉 Ready to save time and boost accuracy?
Use our Class Boundaries Calculator above now and see the difference your analysis can make. Share your results in the comments, and check out our other guides for expert-level tips on statistics and data analysis.
Team ClassRank builds smart, student-friendly calculators to make grade and rank tracking simple and accurate. For questions or feedback, contact us at classrankcalculator@gmail.com.