🚀 Key Features
✅ Smart & Accurate
- Calculates class width, boundaries, and intervals instantly
- Uses correct 0.5 adjustment for continuous data
📊 Frequency Table
- Create multiple class intervals.
- Add frequency values
- Get instant results for each class.
📈 Histogram Chart
- Generate a clear histogram.
- Visualise data easily
- Perfect for assignments
🧠 Step-by-Step Solution
- Shows complete formulas & steps
- Helps you learn while calculating
⚙️ Flexible Control
- Manual override option
- Auto-detection for fast input
🎯 What is Class Width in Statistics?
- Analyse large datasets
- Build histograms
- Understand patterns easily
📌 Class Width Formula:
📊 Class Width Calculator
🎓 Professional statistics tool for frequency distributions, histograms & grouped data
🔢 Class Limits
Auto-detected based on input precision (0.5 for integers, 0.05 for 1 decimal, etc.)
Frequency Distribution
Auto-detected boundary adjustment: 0.5
| # | Lower Limit | Upper Limit | Frequency (f) | Lower Boundary | Upper Boundary | Class Width |
|---|
📊 Histogram
Class Boundaries
Other Academic Calculators
Explore more calculators to track and improve your academic performance.
Class Rank Calculator – Instantly Check Your GPA & Rank
Quickly calculate your GPA, estimate your class rank, and see where you stand among your classmates. Plan for college admissions and track improvement easily.
Academic Performance Calculator – Track Your GPA & Maximise Your Scores
Quickly evaluate your academic performance in real-time. Get instant insights and actionable tips to boost your GPA, attendance, and exam results.
Class Boundaries Calculator – Find Lower & Upper Boundaries Instantly
Calculate class boundaries quickly and accurately with this simple, reliable tool. Perfect for homework and exam preparation with step-by-step explanations.
Class Midpoint Calculator – Find Mean & Midpoints Fast
Instantly calculate class midpoints for single or multiple intervals with step-by-step solutions and frequency-based mean calculation.
⚡ How to Use the Class Width Calculator (Step-by-Step)
- Step 1
- Step 2
- Step 3
- Step 4
- Step 5
- Step 6
Enter Class Limits

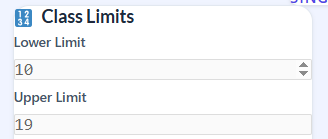
Add the lower limit and upper limit of your class interval in the calculator.
Example: Lower Limit = 10, Upper Limit = 19
✅ Pro Tip: Always double-check your class limits to avoid calculation errors.
Check Boundary Adjustment

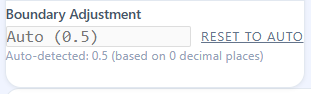
The calculator automatically applies 0.5 adjustment to convert class limits into continuous boundaries.
You can also change it manually if needed.
✅ Pro Tip: Use the automatic adjustment unless you have a specific reason to override it.
View Boundaries

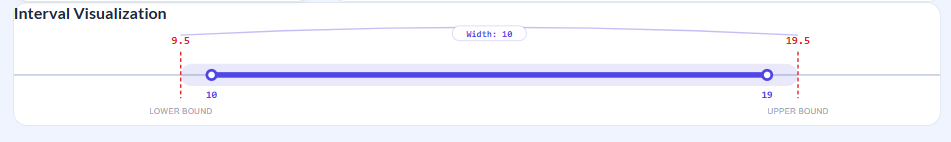
The tool instantly calculates:
Lower Boundary
Upper Boundary
This ensures your intervals are continuous and ready for histogram analysis.
✅ Pro Tip: Understanding boundaries helps you visualize data distribution correctly.
Get Class Width

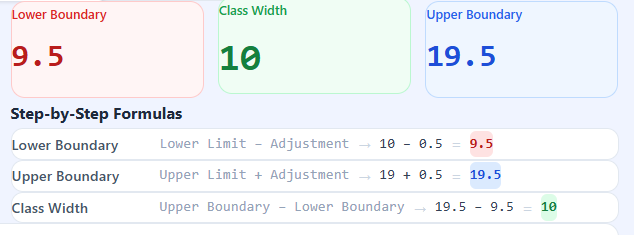
The class width is calculated automatically using the correct formula:
Class Width = Upper Boundary − Lower Boundary
✅ Pro Tip: Learning this formula while using the calculator helps you perform manual calculations if needed.
Use Table Mode (Optional)

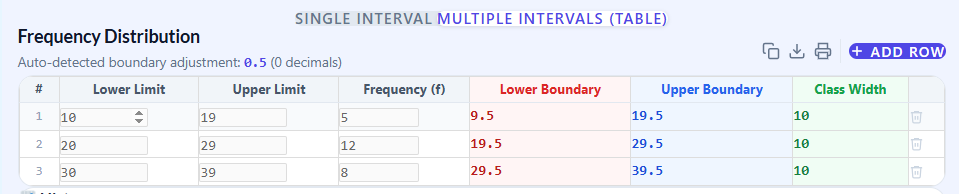
Switch to multiple intervals mode to:
Add more classes
Enter frequency values (f)
Build a full frequency distribution table
✅ Pro Tip: This mode is perfect for assignments and statistical projects.
Analyze Histogram

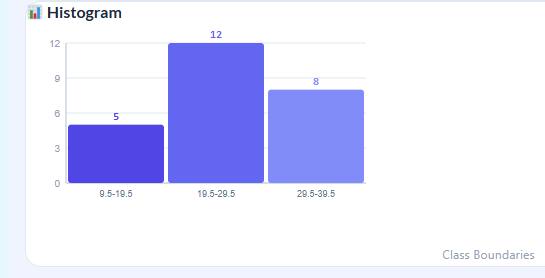
View your data visually using the histogram chart.
Helps you identify trends and patterns in your data.
✅ Pro Tip: Always check the histogram after entering all intervals to ensure your data is grouped correctly.
Step-by-step guidance ensures no calculation errors
Auto-adjusted boundaries provide accurate results
Tables and histogram visualizations improve understanding
Trusted by students for homework, assignments, and exam preparation
🧠 Step-by-Step Example
- Lower Limit = 10
- Upper Limit = 19
- Adjustment = 0.5
Solution:
- Lower Boundary = 10 − 0.5 = 9.5
- Upper Boundary = 19 + 0.5 = 19.5
- Class Width = 19.5 − 9.5 = 10
📊 Frequency Distribution & Histogram
- Build frequency distribution tables.
- Calculate class width for each interval.
- Generate histograms instantly
👉 Ideal for:
- Homework
- Exams
- Data analysis practice
🔍 Why Students Trust This Calculator
- Confusing formulas
- Incorrect boundaries
- Manual calculation errors
✔ Clear step-by-step explanation
✔ Visual learning through charts
✔ Beginner-friendly interface
🎓 Who Should Use This Tool?
This calculator is perfect for:
📚 School & college students
🎓 Statistics learners
📊 Data analysis beginners
📈 Anyone working with grouped data
🚀 Start Calculating Now
Use the Class Width Calculator above to:
✔ Calculate class width instantly
✔ Build frequency distribution tables
✔ Visualize data with histograms
✔ Learn formulas step-by-step
👉 Save time and improve your statistics skills today
📌 Class width calculator FAQs :
❓ What is class width?
Class width is the difference between the upper and lower boundaries of a class interval.
❓ How do you calculate class width in statistics?
Subtract the lower boundary from the upper boundary or use an online calculator for instant results.
❓ Why is 0.5 added or subtracted?
It converts class limits into continuous boundaries for accurate graphs.
❓ Is this calculator good for students?
Yes, it is designed specifically for students to learn and calculate easily.
