Introduction
Wondering why your data ranges don’t match?
When learning statistics, many beginners in the USA struggle with class limits vs class boundaries. These terms look similar, but they serve different purposes in grouped data. If you mix them up, your calculations and charts can become inaccurate.
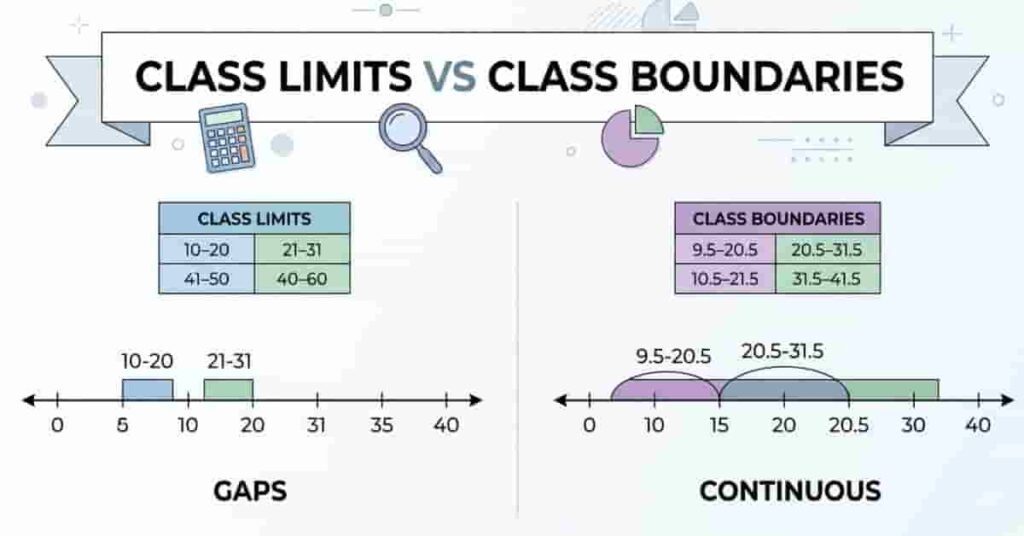
Class limits show the visible range of a class interval. Class boundaries, however, define the true range without gaps. This small difference plays a big role in histograms and continuous data analysis.
In this guide, you’ll clearly understand the difference between class limits and class boundaries with simple examples and tables. By the end, you’ll know when to use each method and avoid common mistakes in statistics. Whether you’re a student or just starting with data analysis, use this guide to clarify your understanding—apply these concepts to your next statistics problem for better results.
🚀 Save time and avoid mistakes! Use our Class Boundaries Calculator to get instant, accurate results for your data.
📊 Class Limits vs Class Boundaries (Quick Comparison Table)
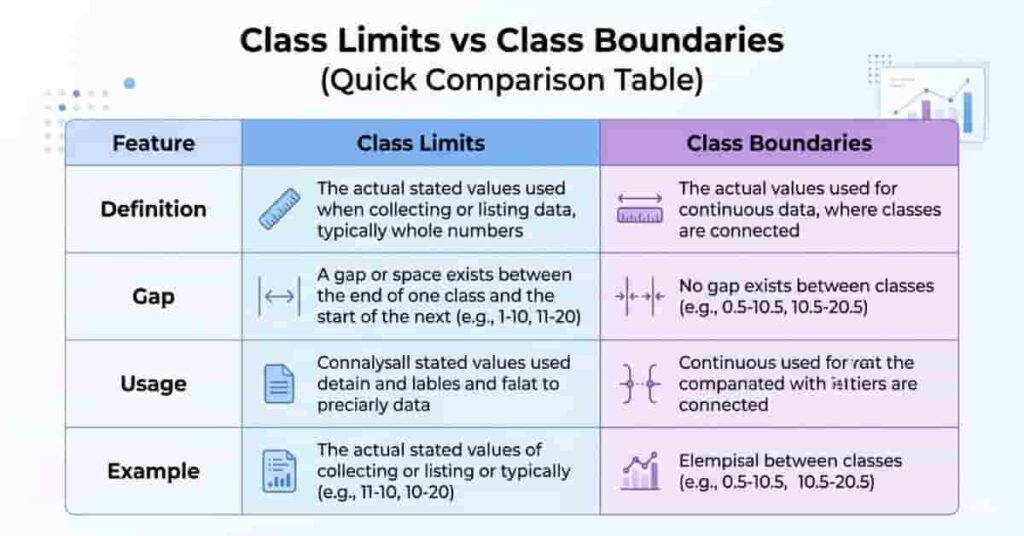
Here’s a quick comparison to clarify class limits vs class boundaries.
“To fully understand this topic, first go through the step-by-step method to calculate class boundaries.”
The table below clearly shows the difference between class limits and class boundaries.
| Definition | Visible values | True limits |
| Gap | May have gaps | No gaps |
| Usage | Basic grouping | Continuous data |
| Example | 10–20 | 9.5–20.5 |
Class limits are the numbers you directly see in a dataset or table. They define the start and end of each class interval. However, they can leave small gaps between classes, which may cause issues in graphs.
Class boundaries fix this problem by removing those gaps. They slightly adjust the limits to create a continuous flow of data. This makes them perfect for histograms and accurate statistical analysis.
Key Takeaways
- Class limits show the visible data range.
- Class boundaries define the true continuous range.
- Use boundaries for precise, accurate graphs.
Pro Tip
If you’re working with charts like histograms, always convert class limits into boundaries first. This avoids gaps and improves accuracy.
📘 What Are Class Limits?
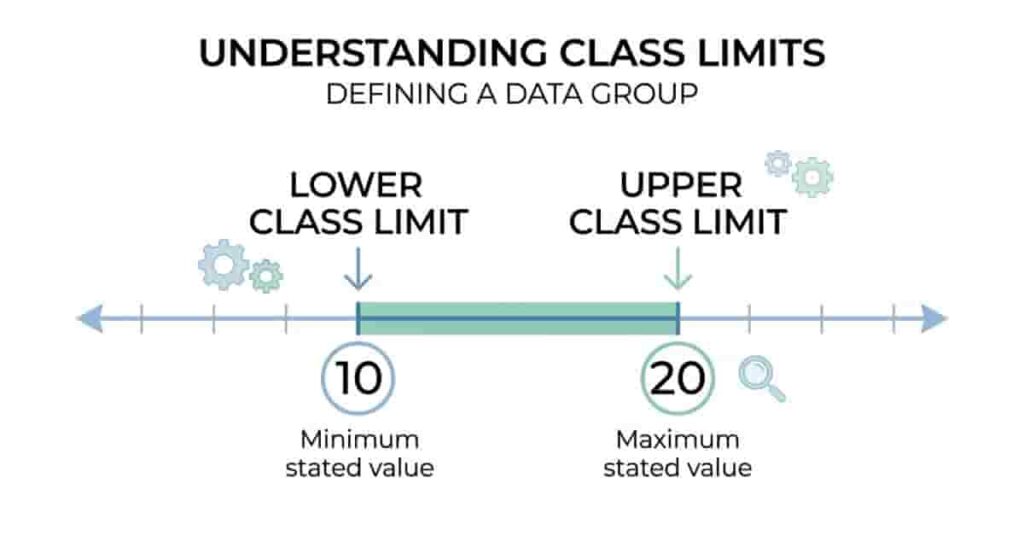
In class, limits vs class boundaries, limits are the starting point for understanding grouped data. In simple terms, a class limit in statistics is the lowest and highest value within a class interval.
Class limits define the visible range of data. They show where each group begins and ends in a table. For example, in the interval 10–20, 10 is the lower limit, and 20 is the upper limit.
While these limits are easy to read and commonly used in basic data grouping, it is important to note that they only show the apparent range, not the exact continuous values between classes. As a result, small gaps can appear when using only class limits.
Key Takeaways
- Class limits define the visible range of a class interval.
- Each class has a lower limit and an upper limit.
- They are mainly used for simple grouping and tables.
Pro Tip
To put this into practice, when solving basic statistics problems, start with class limits. Then, convert them into boundaries if you need more accurate results.
📊 Don’t guess your numbers—try our Class Boundaries Calculator now and see precise class ranges in seconds.
📉 What Are Class Boundaries?
Understanding how to represent data accurately is essential in statistics. Within this context, class boundaries offer a more precise way to display data compared to class limits. A class boundary adjusts class limits to remove gaps between intervals, giving a clearer view of your data.
By offering these adjustments, class boundaries reveal the true range of values in each class. They slightly extend the limits, allowing one class to connect smoothly to the next. For instance, the class 10–20 becomes 9.5–20.5 when converted into boundaries.
As a result, this adjustment prevents any missing values between classes. It ensures data is continuous, which becomes especially important for creating graphs like histograms and frequency distributions.
“You can also explore practical examples of lower and upper class boundaries for clarity.”
Key Takeaways
- Class boundaries show the actual continuous range of data.
- They remove gaps between class intervals.
- They are essential for accurate graphs and analysis.
🔍 Key Differences Between Class Limits and Class Boundaries
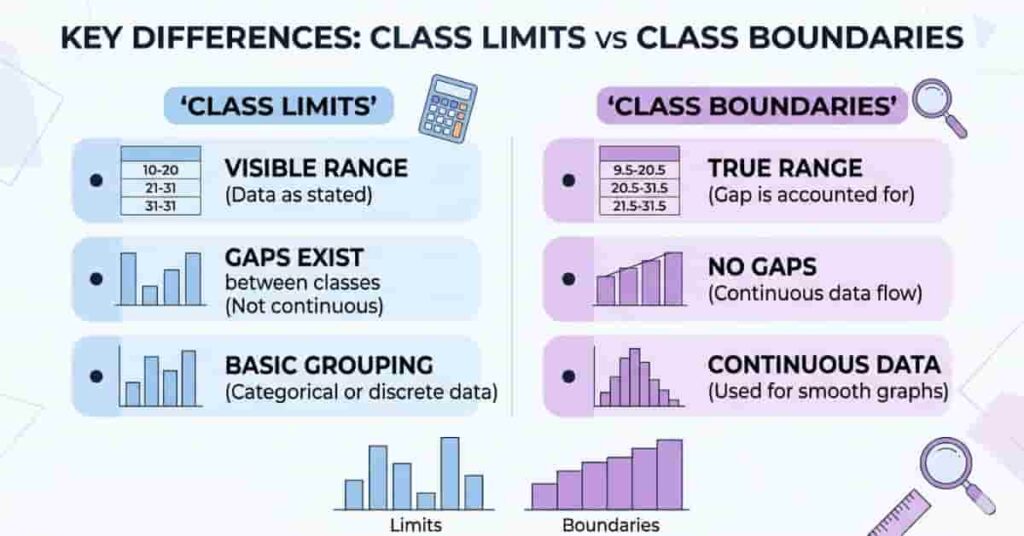
Understanding the class limits and boundaries differences helps you avoid common mistakes in statistics. While both terms describe data ranges, they are used in different ways and serve different purposes.
Here are the key differences explained in a simple and clear format:
- Class limits show the apparent range of a class interval.
- In contrast, class boundaries reveal the actual range without hidden gaps.
- However, using class limits might create gaps between consecutive classes.
- On the other hand, class boundaries eliminate these gaps and ensure data continuity.
Recognizing when to use class limits or boundaries helps you present your data accurately and draw valid conclusions. By choosing the correct approach, you improve both the clarity and reliability of your statistical analysis.
📊 Example (Step-by-Step Comparison)
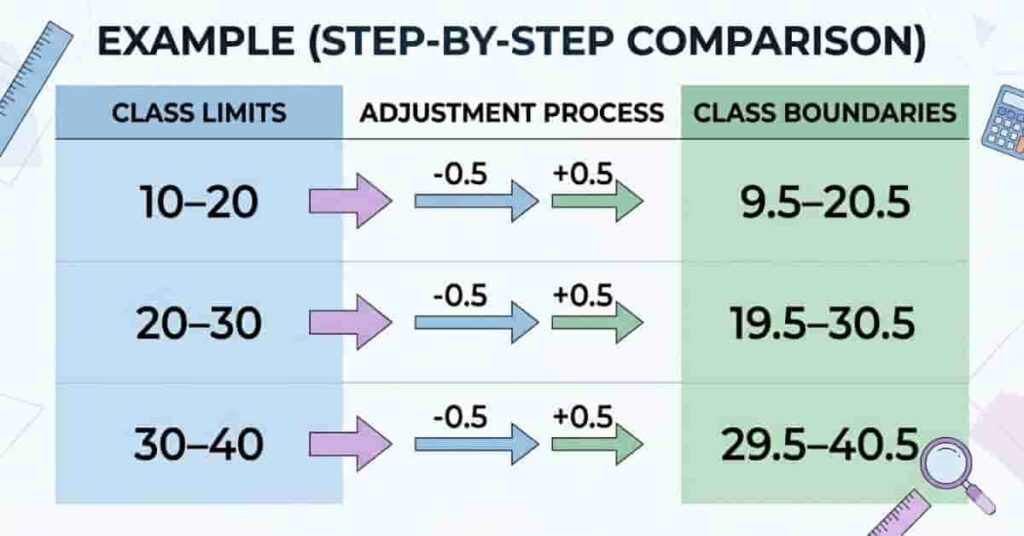
Let’s look at a simple example to understand class limits vs class boundaries in action. This will help you see how small adjustments remove gaps and improve accuracy.
| 10 – 20 | 9.5 – 20.5 |
| 20 – 30 | 19.5 – 30.5 |
In this example, class limits set the ranges as 10–20 and 20–30, which creates a subtle gap at the endpoint of 20.
Next, class boundaries address this gap by slightly adjusting values. This ensures a continuous range, essential for accurate graphs and analysis.
Key Takeaways
- Boundaries remove hidden gaps between classes.
- Continuous data requires adjusted ranges.
🧠 When to Use Class Limits vs Class Boundaries
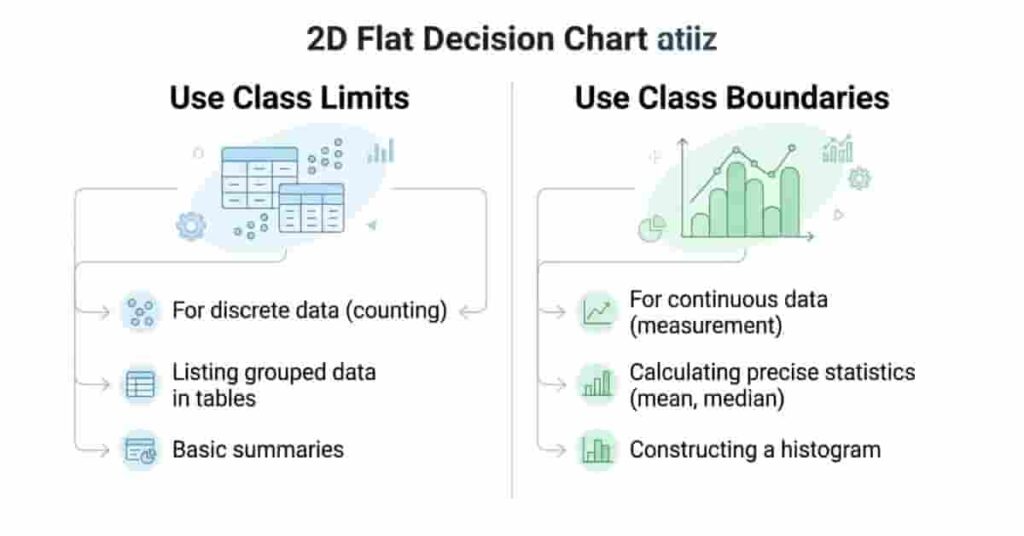
Knowing when to use class limits or boundaries helps you avoid mistakes and choose quickly. Both work well in different situations.
Use class limits for simple data grouping. They suit basic tables where continuity isn’t needed. Beginners often use class limits because they’re easy to read and apply.
Use class boundaries for accuracy. They’re essential for continuous data and histograms. Boundaries remove gaps, making your analysis precise and reliable.
When to Use Class Limits
- Basic grouping of data
- Simple frequency tables
- Quick and easy calculations
When to Use Class Boundaries
- Drawing histograms
- Working with continuous data
- Performing accurate data analysis
Pro Tip
If your work involves graphs or detailed analysis, switch to class boundaries. This step improves your results.
⚠️ Common Confusion Students Face
It’s common for students to feel unsure about class limits versus class boundaries when starting out. Learning these distinctions makes calculations and graphs easier and more accurate.
Here are the most common confusions:
- Assuming limits and boundaries are the same, boundaries adjust limits to remove gaps.
- Remembering decimal adjustment – By including the 0.5 adjustment, you ensure there are no gaps in your data, making your statistics strong.
- Using boundaries in graphs – When you apply class boundaries to your histograms or frequency charts, your data representation stays true and clear!
Recognizing these common challenges early empowers beginners to build skill and confidence in statistics. Using class boundaries correctly keeps your data seamless and your graphs accurate.
Conclusion
In this article, we explored the key differences between class limits and class boundaries. You saw how class limits show the visible range, while boundaries remove gaps for continuous data. We used examples and tables to illustrate these concepts clearly, making it easy for beginners to understand.
When you understand the difference between class limits and class boundaries, you can create accurate tables, histograms, and statistical analyses. Using boundaries ensures you achieve precision and avoid common mistakes like gaps or misaligned graphs.
Take action now—apply class limits and boundaries to your data, or try our Class Boundaries Calculator for instant results. Share your questions or success stories in the comments below, and let us know how these tools improved your statistics skills.
Team ClassRank builds smart, student-friendly calculators to make grade and rank tracking simple and accurate. For questions or feedback, contact us at classrankcalculator@gmail.com.