
Introduction
Struggling to calculate class midpoints quickly during exams?
In statistics, learning how to calculate the class midpoint in Excel can save students hours of manual work. Many beginners in the USA find manual calculations slow and error-prone when handling grouped data. When working with frequency tables, even small mistakes can affect your final results. This is why digital tools like Excel and calculators are becoming essential for students today.
This guide shows simple Excel and calculator methods for finding midpoints, step by step. It will help you work faster, stay accurate, and improve assignment scores.
If you’re new to midpoints, you may want to start with Class Midpoint Basics, which covers step-by-step single interval calculations before moving to Excel methods.
Using Excel, students can automate repetitive steps and reduce errors in statistical assignments. Let’s break everything into simple steps you can follow in minutes.
Want a faster way to calculate midpoints without manual work? Try our class midpoint calculator to get instant and accurate results in seconds.
Midpoint Formula for Calculator & Excel
The midpoint formula helps you quickly find the center value of a class interval. It is widely used in statistics for grouped data. If you are learning how to calculate the class midpoint in Excel, this formula is the foundation of everything you will do.
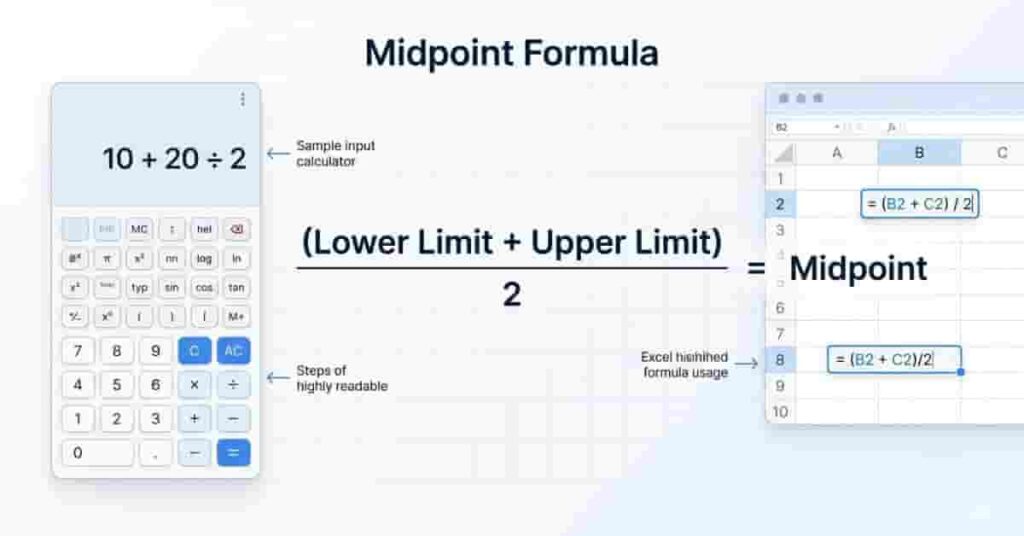
Midpoint=(LowerLimit+UpperLimit)/2Midpoint = (Lower Limit + Upper Limit) / 2Midpoint=(LowerLimit+UpperLimit)/2
To use this on a calculator, follow a simple process. Add the lower limit and upper limit of your class interval, then divide the result by 2. For example, if your interval is 10 to 20, add 10 and 20, and divide by 2 for a result of 15. This gives you the exact center point of the class.
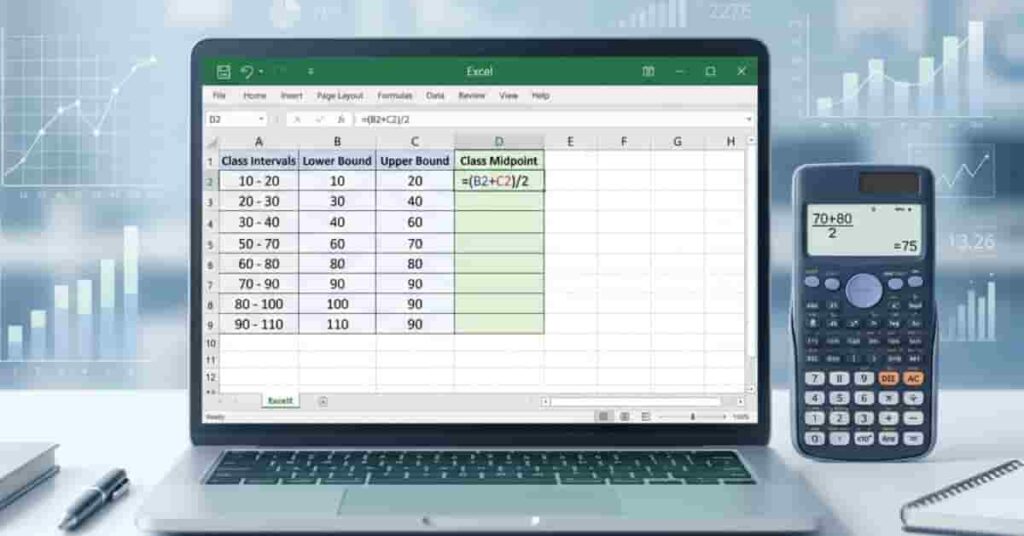
In Excel, the process is even faster. Enter your lower limit in one cell and upper limit in another. Then apply this formula: =(Lower+Upper)/2. Excel instantly returns the midpoint. This reduces errors and saves time when handling multiple rows of data.
If B2 is 10 and C2 is 20, =(B2+C2)/2 returns 15. Drag the formula down for more rows.
This method is useful for students in statistics, as it speeds up accurate calculations for large datasets.
Step-by-Step Excel Guide
Learning how to calculate the class midpoint in Excel becomes easy when you follow a clear step-by-step process. Excel helps students handle multiple class intervals without having to repeat manual calculations. This is especially useful in statistics assignments where accuracy and speed both matter.
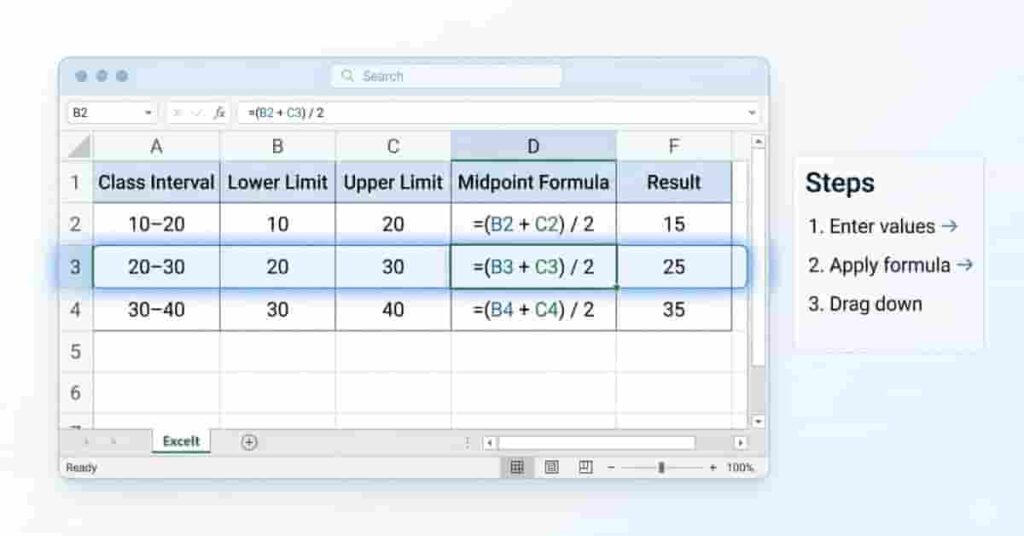
Start by setting up a simple table in Excel. Create columns for Class Interval, Lower Limit, Upper Limit, and Midpoint Formula. Enter your data in a clean format so formulas work correctly and can be dragged down without errors.
Here is a simple example:
| 10 – 20 | 10 | 20 | =(B2+C2)/2 |
| 20 – 30 | 20 | 30 | =(B3+C3)/2 |
| 30 – 40 | 30 | 40 | =(B4+C4)/2 |
Now follow these steps carefully:
- Enter the lower limit values in one column.
- Enter upper limit values in the next column.
- In the midpoint column, use the formula =(B2+C2)/2, where B2 is the lower limit cell and C2 is the upper limit cell for the first interval.
- Replace B2 and C2 with the actual cell addresses that correspond to each interval row as you drag the formula down.
- Drag the formula down to fill all intervals.
Excel automatically calculates each midpoint, saving time and reducing mistakes. This method is especially helpful when working with large datasets or frequency distribution tables.
You can also format the table for better readability. Use borders, bold headers, and consistent spacing to make your worksheet look clean for submission or printing. This improves both presentation and clarity in academic work.
A useful real-world tip is to always double-check one or two results manually. This ensures your formula is working correctly before applying it to the full dataset.
Many students in statistics courses lose marks due to small formula errors. Professionals always verify the first row before dragging formulas down the sheet.
Calculator Tips & Best Practices
Using a calculator for class midpoints can make your work faster, but small mistakes can still affect your results. If you are learning how to calculate the class midpoint in Excel or on a calculator, following the right habits will improve both speed and accuracy.
Stay organized when entering intervals. Type values carefully and in the same order. Write values on paper first for long assignments, then enter them step by step.
If your calculator supports memory or history functions, use them to reduce repeated input—especially when working with many intervals in one task. This approach also helps you verify previous calculations without having to start over.
Export results from Excel after calculating midpoints. Many students copy results into Word or PDF. You can also print your Excel sheet. Make sure tables are neat and readable.
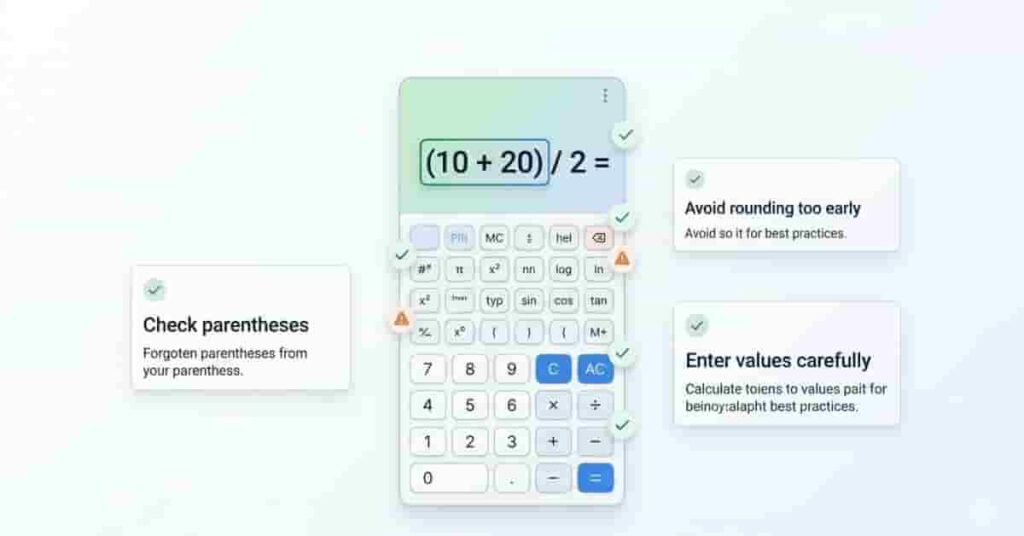
Avoid common mistakes, such as mixing lower and upper limits or omitting parentheses. Another frequent error is rounding too early, which can slightly change the final results in statistics problems. Always complete the full calculation before rounding.
Ready to save time on your assignments? Use our class midpoint calculator to quickly calculate intervals and avoid mistakes with just one click.
Visual / Interactive Suggestions
Visuals make midpoint calculations easier to understand, especially for beginners using Excel or calculators. If you are learning how to calculate the class midpoint in Excel, clear visuals help you avoid mistakes and follow the steps faster. Students in the USA often rely on screenshots and templates for assignments and exam revision. These visuals also improve accuracy when working with multiple class intervals.
An Excel screenshot of your full table is helpful. Include class intervals, lower limits, upper limits, and the midpoint formula for each row. Highlight the formula bar so students can see how =(B2+C2)/2 works. This helps beginners link theory with practice.
Another helpful visual is a screenshot of a calculator interface. It should show step-by-step input, such as entering the lower limit, adding the upper limit, and dividing by 2. Label each step clearly so students can follow the process without confusion. This is especially useful for exam practice and quick calculations.
You can also offer a downloadable Excel template for students. This template should already include columns and ready-to-use formulas. Students only need to enter values; Excel will automatically calculate the midpoints. This saves time and reduces the risk of formatting errors.
Quick Tips & Student Advice
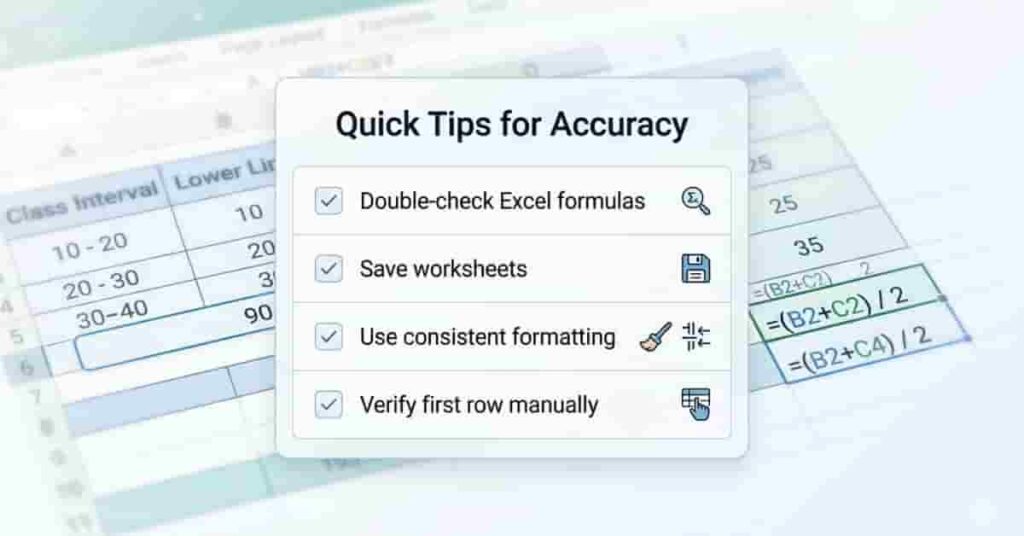
Simple habits improve Excel statistics. To calculate the class midpoint, use these quick tips to avoid errors and improve your assignment.
Always double-check your Excel formulas with a quick manual calculation. This ensures your cell references are correct and your results are accurate. Even a small mistake in one cell can affect the entire dataset, especially when you drag formulas down multiple rows.
Save your Excel worksheets instead of creating a new file each time. This helps you reuse the same structure for future assignments or exams. It also saves time when you need to revise or update data later.
Keep your formatting consistent throughout the sheet. Use clear headers, aligned columns, and proper spacing. Clean formatting makes your work easier to read and improves your presentation in academic submissions.
Many students overlook consistency, but it plays a key role in scoring better marks. Teachers often prefer well-organized tables over messy calculations, even if the answers are correct.
Start using these proven methods today to boost your performance with Excel statistics. Applying structured Excel practices can make your assignments stand out and set you up for success.
Conclusion
Learning how to calculate the class midpoint in Excel becomes much easier when you follow step-by-step methods. This guide showed you formulas, Excel setup, calculator use, and best practices for accurate results.
The how-to-calculate-class-midpoint-in-Excel method helps students save time and reduce errors in statistics assignments. With simple formulas like =(Lower+Upper)/2, you can quickly handle multiple class intervals. These skills are useful for creating frequency tables, completing homework, and preparing for exams.
If you feel stuck, revisit the basics and practice with small datasets first. Build confidence and improve accuracy over time by practicing.
If you’re new to class midpoints, start with Class Midpoint Basics to learn the foundational step-by-step method. Explore more Excel and calculator guides on our site to further strengthen your statistics skills.
Team ClassRank builds smart, student-friendly calculators to make grade and rank tracking simple and accurate. For questions or feedback, contact us at classrankcalculator@gmail.com.