


Table of Contents
Introduction
Have you ever struggled to keep track of running totals in Excel? Learning how to calculate cumulative frequency in Excel is easier than you might think. Whether you’re analyzing survey results, classroom data, or business reports, Excel helps you organize information quickly and accurately. It also reduces calculation errors that often happen with manual methods, making it a trusted choice for beginners and professionals across the USA. If you need even faster results, you can also use our Cumulative Frequency Calculator to generate cumulative frequencies instantly without writing a single formula.
In this guide, you’ll learn two simple methods for calculating cumulative frequency in Excel, along with the steps to find excel cumulative relative frequency values and create professional cumulative frequency tables and charts. Each example is explained in plain language, so you can follow along with confidence. By the end, you’ll know exactly which method works best for your data and when an online calculator can save you valuable time.
What Is Cumulative Frequency?
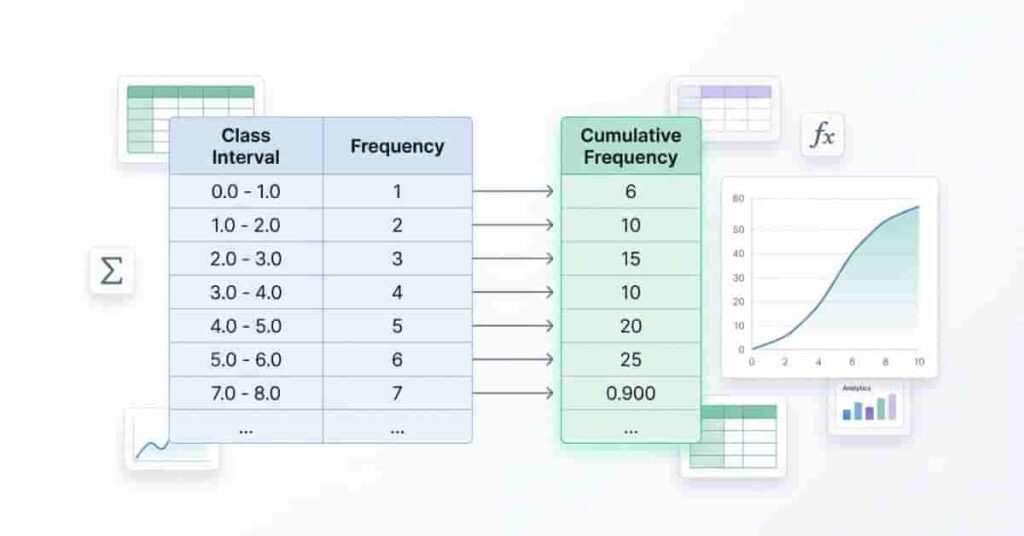
Cumulative frequency is the running total of frequencies in a dataset. It shows how values add up as you move through the data from the smallest to the largest value. If you’re learning how to calculate cumulative frequency in Excel, understanding this concept is the first step.
Instead of looking at each frequency separately, cumulative frequency combines them. This makes it easier to see how many observations fall below or within a specific value or class interval. Teachers, students, researchers, and business analysts often use it to summarize large datasets.
If you are new to the concept, first review how cumulative frequency works and how running totals are calculated from a frequency distribution.
Definition
A frequency tells you how many times a value appears. A cumulative frequency adds each frequency to the total before it. The result is a running total that grows with every row.
For example, if the frequencies are 3, 5, 7, and 4, the cumulative frequencies become 3, 8, 15, and 19. Each new value includes all previous frequencies.
This method works for both simple frequency tables and grouped data. It also forms the basis for cumulative frequency graphs, also called ogives.
Pro Tip: Always sort your data in ascending order before calculating cumulative frequency. Unsorted data can produce incorrect running totals.
Why It Is Important
Cumulative frequency helps you understand how data is distributed. Instead of checking each value individually, you can quickly find how many observations fall below a certain point.
This makes data analysis much easier. For example, teachers can track student scores, businesses can study customer purchases, and researchers can summarize survey responses.
A small classroom test provides a simple example. Imagine a teacher wants to know how many students scored 80 or below. Instead of counting each score manually, a cumulative frequency table gives the answer instantly.
You can also use cumulative frequency to calculate percentiles, medians, quartiles, and create cumulative distribution graphs.
Pro Tip: If you plan to create charts later, build your cumulative frequency table first. It keeps your analysis organized and saves time.
When Should You Use Excel?
Excel is a great choice when you need to work with medium or large datasets. It automates calculations, reduces manual errors, and updates results whenever your data changes.
Use Excel when you need to:
- Calculate cumulative frequency for assignments or reports.
- Analyze survey or business data.
- Create frequency tables and ogive charts.
- Calculate excel cumulative relative frequency.
- Reuse formulas for different datasets.
If you only need quick results without formulas, an online Cumulative Frequency Calculator can save time. It generates accurate cumulative frequencies instantly from your dataset.
Prepare Your Data in Excel
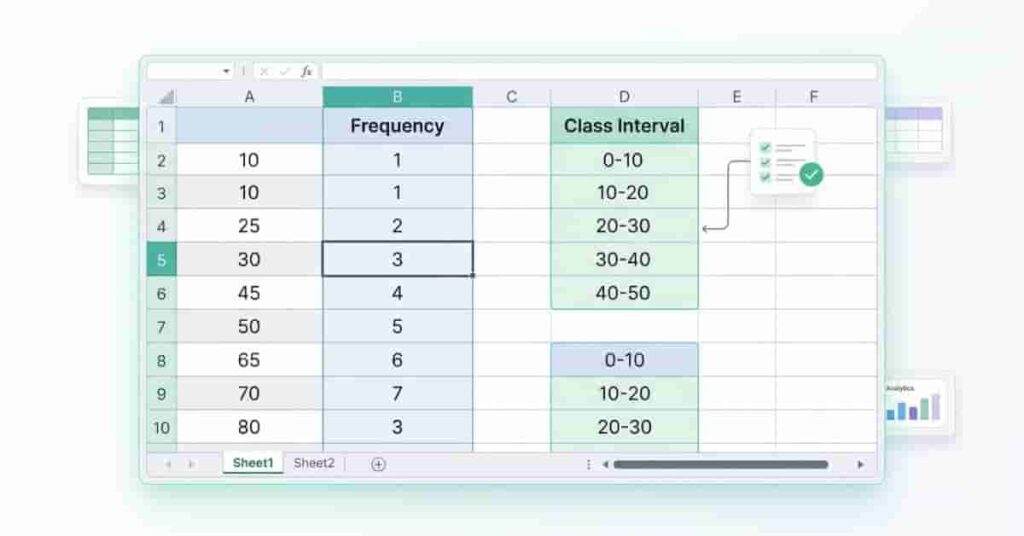
Before you calculate cumulative frequency, organize your worksheet correctly. A clean layout makes formulas easier to write and reduces mistakes. Whether you have raw observations or grouped data, the preparation process stays simple.
Start by entering your original values into one column. If your dataset contains repeated values, create a frequency table that counts how many times each value appears. For grouped data, add class intervals before calculating frequencies.
A basic worksheet might look like this:
| Score | Frequency |
|---|---|
| 10 | 2 |
| 20 | 5 |
| 30 | 4 |
| 40 | 6 |
| 50 | 3 |
For grouped data, organize it like this:
| Class Interval | Frequency |
| 0–10 | 4 |
| 11–20 | 7 |
| 21–30 | 6 |
| 31–40 | 5 |
Keep each column clearly labeled. Avoid blank rows because they can interfere with formulas and charts.
If you’re working with raw data, you can use Excel’s COUNTIF function to build the frequency table before calculating cumulative frequency.
After calculating the running totals, you can learn how to create a cumulative frequency table for grouped data and organize your results more clearly.
Method 1: Calculate Cumulative Frequency Using the SUM Formula
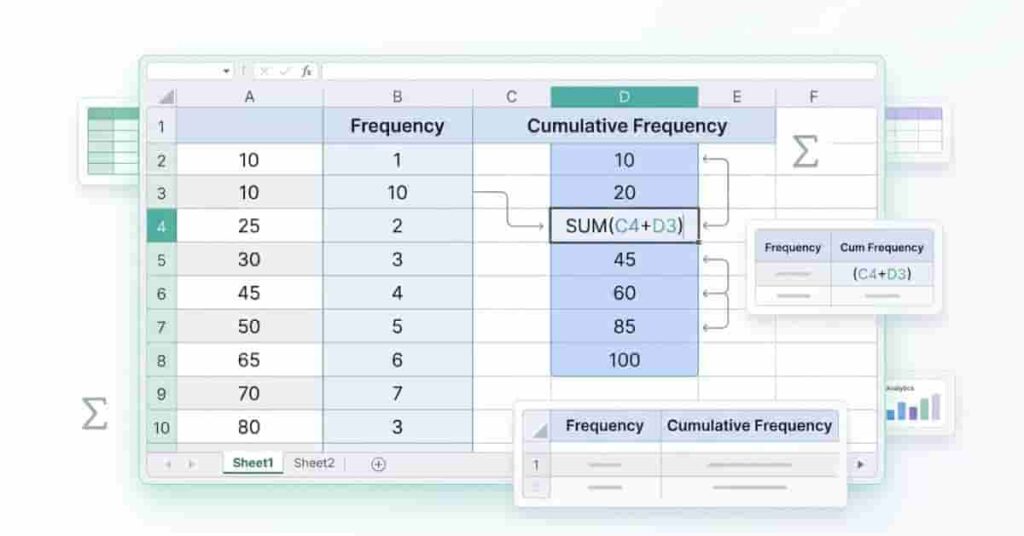
The SUM function is one of the easiest ways to calculate cumulative frequency in Excel. It creates a running total by adding all previous frequency values to the current one. This method works well for both small and large datasets.
Step 1: Enter Your Frequency Values
Place your frequency values in one column. For example, enter them in cells B2.
| Value | Frequency |
| 10 | 2 |
| 20 | 5 |
| 30 | 4 |
| 40 | 6 |
| 50 | 3 |
Step 2: Write the First Cumulative Frequency
Click cell C2 and enter:
=B2The first cumulative frequency is always the first frequency.
Step 3: Use the SUM Formula
In cell C3, enter:
=SUM($B$2:B3)The dollar signs lock the starting cell while the ending cell changes as you move down the worksheet. This creates a running total automatically.
Step 4: Copy the Formula Down
Drag the fill handle from C3 to the last row. Excel updates the formula for every row.
Your completed table should look like this:
| Value | Frequency | Cumulative Frequency |
| 10 | 2 | 2 |
| 20 | 5 | 7 |
| 30 | 4 | 11 |
| 40 | 6 | 17 |
| 50 | 3 | 20 |
The SUM approach is easy to verify because every cumulative value equals the total of all previous frequencies.
Calculate Cumulative Frequency Using Running Totals
Another simple way to calculate cumulative frequency in Excel is by using running totals. Instead of adding every value with the SUM function, this method adds the current frequency to the previous cumulative frequency. It uses shorter formulas and works well for most datasets.
Many Excel users prefer this approach because it is easy to understand. Once you create the first cumulative value, Excel handles the remaining calculations with a simple addition formula.
Step 1: Reference the Previous Cumulative Value
Assume your frequency values are in Column B and your cumulative frequency will appear in Column C.
Enter the first cumulative frequency in C2:
=B2This value becomes the starting point for all remaining calculations.
Step 2: Add the Current Frequency
In the next row (C3), enter:
=C2+B3This formula adds the current frequency to the previous cumulative frequency. Every new row builds on the total above it.
Step 3: Drag the Formula Through the Dataset
Select C3 and drag the fill handle down the column. Excel automatically updates the references.
For example:
| Value | Frequency | Cumulative Frequency |
|---|---|---|
| 10 | 2 | 2 |
| 20 | 5 | 7 |
| 30 | 4 | 11 |
| 40 | 6 | 17 |
| 50 | 3 | 20 |
The cumulative frequency increases with each row until it reaches the total number of observations.
Running Totals vs. SUM Formula
Both methods produce the same results, but they work differently.
| Feature | Running Totals | SUM Formula |
| Formula | =C2+B3 | =SUM($B$2:B3) |
| Easy to Learn | ✅ Yes | ✅ Yes |
| Easy to Audit | Moderate | Excellent |
| Best for Large Reports | Good | Excellent |
| Updates Automatically | ✅ Yes | ✅ Yes |
An experienced Excel user might choose the SUM method for reports because it is easier to audit. The running total method is often faster to type and easier for beginners to understand.
You can take your Excel analysis further by learning how cumulative relative frequency shows the proportion of observations below each value.
How to Calculate Cumulative Relative Frequency in Excel
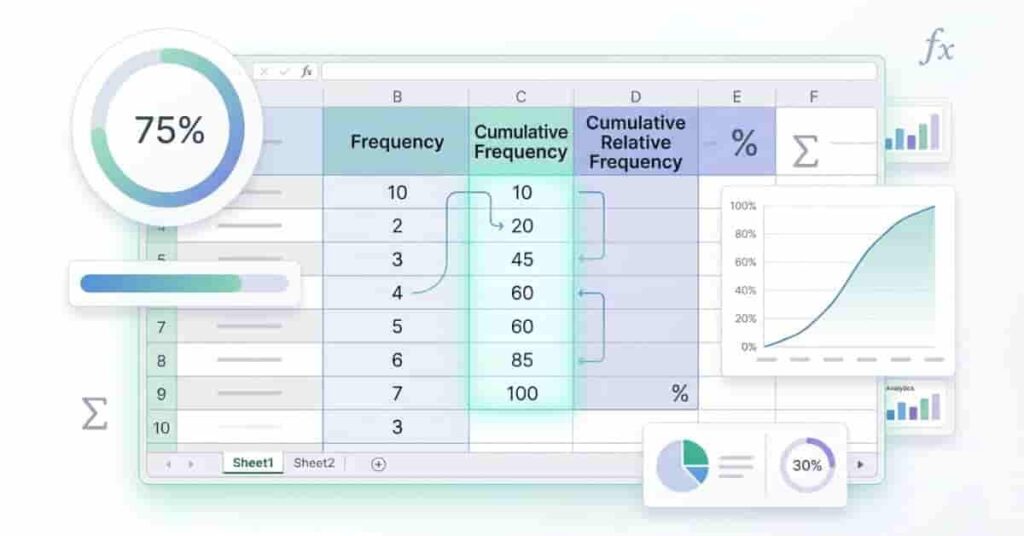
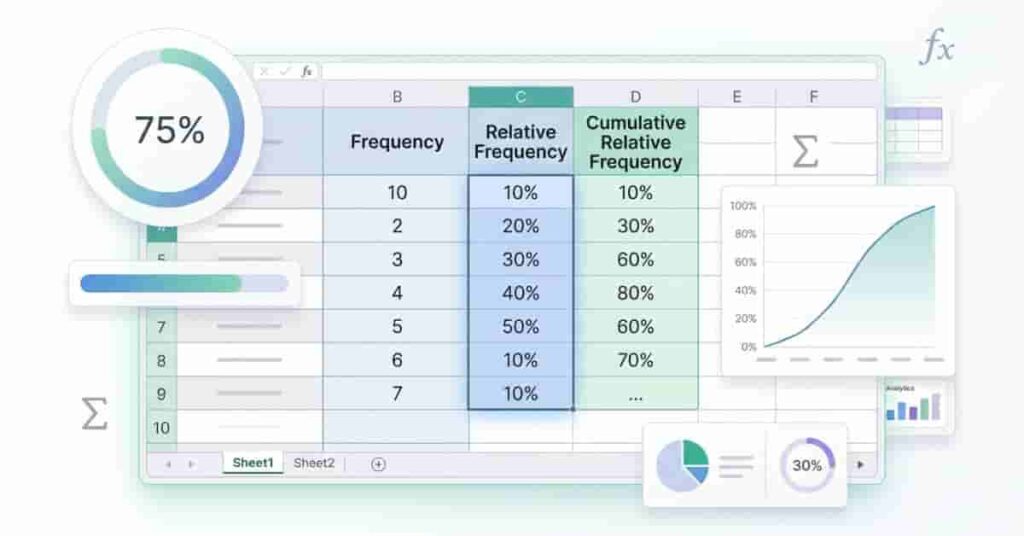
Cumulative relative frequency shows the percentage of observations that fall at or below each value. It combines relative frequencies into a running percentage, making it easier to understand how data accumulates across a dataset. Excel can calculate these values with a few simple formulas.
Step 1: Find the Total Frequency
First, calculate the total of all frequency values.
If your frequencies are in B2, enter this formula in another cell:
=SUM(B2:B6)Suppose the total frequency is 20.
Step 2: Calculate Relative Frequency
Create a new column named Relative Frequency.
In C2, enter:
=B2/$B$7Replace B7 with the cell that contains your total frequency. Copy the formula down the column.
Step 3: Calculate Cumulative Relative Frequency
Create another column called Cumulative Relative Frequency.
In D2, enter:
=C2In D3, enter:
=D2+C3Drag the formula down to the last row. The final value should equal 1.00, or 100% after formatting.
Step 4: Format the Values as Percentages
Select the Relative Frequency and Cumulative Relative Frequency columns.
Go to Home → Number → Percentage and choose the number of decimal places you want to display.
If you only need the cumulative frequency results, our Cumulative Frequency Calculator can perform the calculations without requiring an Excel formula.
Worked Example
| Value | Frequency | Relative Frequency | Cumulative Relative Frequency |
| 10 | 2 | 10% | 10% |
| 20 | 5 | 25% | 35% |
| 30 | 4 | 20% | 55% |
| 40 | 6 | 30% | 85% |
| 50 | 3 | 15% | 100% |
This table shows both the proportion of each value and the running percentage across the dataset. These calculations are useful when creating reports, comparing distributions, or building an ogive chart.
Expert Tip: Check that your final cumulative relative frequency equals 100%. If it does not, review your formulas and total frequency for errors.
How to Create a Cumulative Frequency Table in Excel

A cumulative frequency table organizes your data into a clear format. It shows the frequency, running total, and cumulative relative frequency in one place. This makes it easier to analyze your dataset and create charts later.
Start by creating four column headings in Excel:
- Class Interval
- Frequency
- Cumulative Frequency
- Cumulative Relative Frequency
Next, enter your class intervals and frequency values. Then calculate the cumulative frequency using either the SUM method or the running total method discussed earlier. Finally, calculate the cumulative relative frequency by dividing each cumulative frequency by the total number of observations.
Here’s a complete example:
| Class Interval | Frequency | Cumulative Frequency | Cumulative Relative Frequency |
|---|---|---|---|
| 0–10 | 4 | 4 | 18.2% |
| 11–20 | 6 | 10 | 45.5% |
| 21–30 | 5 | 15 | 68.2% |
| 31–40 | 4 | 19 | 86.4% |
| 41–50 | 3 | 22 | 100% |
This table gives you a complete view of how observations accumulate across each class interval. It also prepares your data for an ogive, percentile calculations, and other statistical analyses.
A college instructor, for example, could use this table to see how many students scored within or below each score range. Instead of reviewing every individual score, the table provides a quick summary.
Before finishing, check that the last cumulative frequency equals the total frequency. Also, make sure the final cumulative relative frequency equals 100%.
Takeaways
- Create separate columns for class intervals, frequencies, cumulative frequencies, and cumulative relative frequencies.
- Calculate cumulative frequency before finding cumulative relative frequency.
- Verify that the final cumulative frequency matches the total number of observations.
- A well-organized table makes charts and reports much easier to create.
Create a Cumulative Frequency Chart (Ogive) in Excel
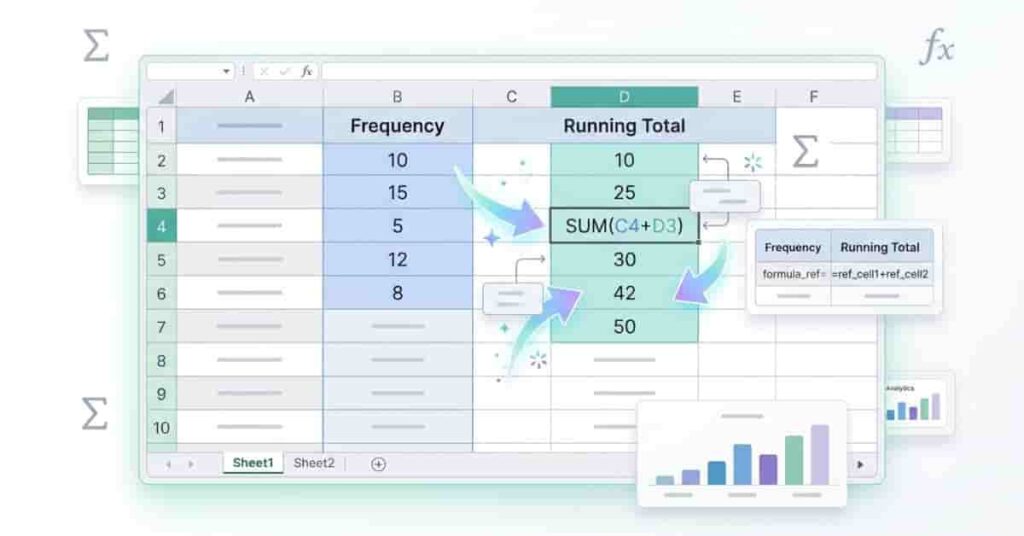
An ogive is a line graph that displays cumulative frequency. It helps you see how values accumulate across class intervals and makes trends easier to understand than a table alone. Once your cumulative frequency table is complete, Excel can create an ogive in just a few steps.
Step 1: Select the Table
Highlight the Class Interval and Cumulative Frequency columns. Include the column headings so Excel labels the chart correctly.
Step 2: Insert a Line or Scatter Chart
Go to the Insert tab and choose either:
- Line Chart for a simple cumulative trend, or
- Scatter Chart with Straight Lines for a more traditional ogive.
Both options display the running total across your class intervals.
Step 3: Format the Chart
Improve readability by making a few adjustments:
- Add a chart title such as Cumulative Frequency (Ogive).
- Label the horizontal axis with class intervals.
- Label the vertical axis with cumulative frequency.
- Add gridlines if they improve readability.
- Use consistent fonts and spacing for a professional appearance.
Step 4: Interpret the Ogive
Read the graph from left to right. As the line rises, it shows the total number of observations up to each class interval. A steeper section indicates many observations within that range, while a flatter section shows fewer observations.
For example, if the ogive reaches 15 at the 21–30 interval, it means 15 observations fall within or below that range.
The ogive also helps estimate medians, percentiles, and quartiles. This makes it useful for classroom assignments, research projects, and business reporting.
Worked Example
Let’s put everything together with one complete example. This dataset shows how to calculate frequency, cumulative frequency, relative frequency, and cumulative relative frequency in Excel. Following a real example makes it much easier to understand how to calculate cumulative frequency in Excel.
Assume you have the following frequency table:
| Score Range | Frequency | Cumulative Frequency | Relative Frequency | Cumulative Relative Frequency |
|---|---|---|---|---|
| 0–10 | 3 | 3 | 15% | 15% |
| 11–20 | 5 | 8 | 25% | 40% |
| 21–30 | 4 | 12 | 20% | 60% |
| 31–40 | 6 | 18 | 30% | 90% |
| 41–50 | 2 | 20 | 10% | 100% |
Here’s how each column is calculated:
- Frequency: Count of observations in each class interval.
- Cumulative Frequency: Running total of all previous frequencies.
- Relative Frequency: Frequency ÷ Total Frequency.
- Cumulative Relative Frequency: Running total of the relative frequencies.
If your frequencies are in B2, your formulas may look like this:
| Column | Example Formula |
| Total Frequency | =SUM(B2:B6) |
| First Cumulative Frequency | =B2 |
| Next Cumulative Frequency | =SUM($B$2:B3) |
| Relative Frequency | =B2/$B$7 |
| Cumulative Relative Frequency | =C2/$B$7 (or use a running total of the relative frequency column) |
After entering the formulas, drag them down to complete the table. Excel updates every row automatically, saving time and reducing manual errors.
The final worksheet gives you a complete summary of your dataset. You can also use it to build an ogive, calculate percentiles, or prepare a professional report.
Common Excel Mistakes
Excel makes cumulative frequency calculations simple, but small mistakes can produce incorrect results. Reviewing your formulas before using the data can save time and improve accuracy.
Here are the most common mistakes beginners make:
Incorrect Cell References
Using the wrong cell reference is one of the most common errors. If a formula points to the wrong cell, every result below it may also be incorrect.
Wrong SUM Range
When using the SUM method, always lock the starting cell with absolute references.
Correct example:
=SUM($B$2:B3)If you forget the dollar signs, Excel changes the starting cell when you copy the formula.
Copying Formulas Incorrectly
Dragging formulas into the wrong rows or skipping rows creates incorrect cumulative totals. Always compare the final cumulative frequency with the total frequency to verify your results.
Formatting Percentages Incorrectly
Relative frequencies should appear as percentages. If Excel displays decimals instead, apply the Percentage number format.
Using Unsorted Data
Always sort values or class intervals in ascending order before calculating cumulative frequency. Unsorted data produces misleading running totals and incorrect charts.
Expert Tip: After completing your worksheet, confirm two values. The final cumulative frequency should equal the total frequency, and the cumulative relative frequency should equal 100%.
Excel vs Online Cumulative Frequency Calculator
Excel is an excellent tool for data analysis, especially when you need to customize formulas, build charts, or prepare reports. However, if your goal is to calculate cumulative frequencies quickly, an online calculator can save valuable time.
The right choice depends on your needs. Students working on assignments may prefer Excel, while users who need instant results often choose an online calculator.
| Feature | Excel | Online Calculator |
| Requires formulas | ✅ Yes | ❌ No |
| No formulas needed | ❌ No | ✅ Yes |
| Flexible | ✅ Excellent | Good |
| Speed | Moderate | ✅ Instant |
| Best for reports | ✅ Yes | Limited |
| Best for quick calculations | Good | ✅ Excellent |
| Learning curve | Moderate | Beginner-friendly |
If you regularly analyze large datasets, Excel remains a powerful option. However, if you simply want accurate cumulative frequencies without remembering formulas, our Cumulative Frequency Calculator is the faster solution.
Just enter your data, and the calculator automatically generates the frequency table, cumulative frequencies, and other results in seconds.
For quick verification, enter your frequency values into the online cumulative frequency calculator and compare its results with your Excel worksheet.
How to Use Our Cumulative Frequency Calculator
If you want accurate results without writing Excel formulas, our Cumulative Frequency Calculator makes the process simple. It performs all calculations automatically and is ideal for students, teachers, researchers, and professionals.
Follow these steps:
- Enter or paste your dataset into the calculator.
- Generate the frequency table with one click.
- View cumulative frequencies instantly, along with relative and cumulative relative frequencies.
- Copy or export your results for reports, homework, or further analysis.
The calculator removes the need to remember formulas or troubleshoot spreadsheet errors. It also works well when you need quick answers during assignments or data analysis.
Whether you’re learning how to calculate cumulative frequency on Excel or simply need instant results, the calculator helps you finish the task faster while maintaining accuracy.
Try the Cumulative Frequency Calculator to calculate cumulative frequencies instantly and create accurate tables without writing a single Excel formula.
Conclusion
In this guide, you learned how to calculate cumulative frequency in Excel using both the SUM formula and the running totals method. You also learned how to create cumulative frequency tables, calculate excel cumulative relative frequency, and build an ogive chart to visualize your data. These skills make Excel a reliable tool for assignments, reports, and everyday data analysis.
If you need results quickly, our Cumulative Frequency Calculator is an even faster option. It calculates cumulative frequencies instantly without formulas, helping you save time while avoiding common spreadsheet errors. As your next step, explore our guide on How to Create a Cumulative Frequency Table to strengthen your understanding and improve your Excel skills. If you found this guide helpful, share it with others, leave a comment below, or explore more statistics tutorials and calculators on our website.
1. How do you calculate cumulative frequency in Excel?
To calculate cumulative frequency in Excel, first create a frequency table. Enter the first cumulative frequency as the first frequency value. Then use either the SUM formula (=SUM($B$2:B3)) or the running totals formula (=C2+B3) to calculate the remaining values. Copy the formula down the column to complete the cumulative frequency table.
2. Which Excel formula is best for cumulative frequency?
The SUM formula is the most reliable choice because it is easy to review and works well with large datasets. A common formula is =SUM($B$2:B3), which creates a running total while keeping the starting cell fixed. The running totals method (=C2+B3) is also accurate and beginner-friendly.
3. Can Excel calculate cumulative relative frequency?
Yes. Excel can calculate cumulative relative frequency after you determine the total frequency. Divide each frequency by the total to calculate the relative frequency, then create a running total of those percentages or divide each cumulative frequency by the total frequency. Finally, format the values as percentages.
4. How do I create a cumulative frequency table in Excel?
Create columns for Class Interval, Frequency, Cumulative Frequency, and Cumulative Relative Frequency. Enter your data, calculate the cumulative frequency using either the SUM or running totals method, and then calculate cumulative relative frequency. This table can also be used to create an ogive chart.
5. Can I create an ogive chart in Excel?
Yes. Once your cumulative frequency table is complete, select the class intervals and cumulative frequency columns. Insert a Line Chart or Scatter Chart with Straight Lines, then add chart titles and axis labels. The resulting ogive clearly shows how cumulative values increase across the dataset.
6. Why is my cumulative frequency formula incorrect?
Formula errors usually occur because of incorrect cell references, the wrong SUM range, unsorted data, or copying formulas incorrectly. Always verify that the final cumulative frequency equals the total frequency. If you use the SUM method, lock the starting cell with absolute references such as $B$2.
7. Should I sort data before calculating cumulative frequency?
Yes. Always sort your values or class intervals in ascending order before calculating cumulative frequency. Running totals only make sense when the data follows the correct order. Unsorted data can produce inaccurate cumulative frequencies and misleading charts.
8. Is Excel better than manual calculation?
For most users, yes. Excel performs calculations automatically, reduces human error, and updates results whenever the data changes. It is ideal for assignments, research, business reports, and statistical analysis. Manual calculations are useful for learning but become slow with larger datasets.
9. Is there an online Cumulative Frequency Calculator?
Yes. An online Cumulative Frequency Calculator provides instant results without requiring Excel formulas. Simply paste or enter your dataset, and the calculator automatically generates the frequency table, cumulative frequency, and cumulative relative frequency. It is perfect for quick and accurate calculations.
10. Can I use Excel for grouped frequency distributions?
Absolutely. Excel works well with grouped frequency distributions. Create class intervals, enter the corresponding frequencies, and calculate cumulative frequencies using the same formulas explained in this guide. You can also use the completed table to build an ogive chart.
11. What is the difference between frequency and cumulative frequency?
A frequency shows how many observations fall into a particular value or class interval. Cumulative frequency is the running total of those frequencies. It helps you determine how many observations fall at or below a specific value and is useful for finding percentiles, medians, and quartiles.
12. Which method is easier: SUM formula or running totals?
Both methods produce the same results. The SUM formula is easier to audit because every formula references the complete range of frequencies. The running totals method uses shorter formulas and is often easier for beginners. Choose the one that best suits your workflow.
13. Can I calculate cumulative frequency from raw data in Excel?
Yes. Start by creating a frequency table using functions like COUNTIF or a PivotTable. After generating the frequency counts, use the SUM formula or the running totals method to calculate cumulative frequency. This approach works for both small and large datasets.
14. When should I use an online calculator instead of Excel?
Use Excel when you need customized formulas, charts, or detailed reports. Choose an online Cumulative Frequency Calculator when you want fast, accurate results without writing formulas. It is especially useful for homework, quick data analysis, and everyday statistical calculations.

Team ClassRank builds smart, student-friendly calculators to make grade and rank tracking simple and accurate. For questions or feedback, contact us at classrankcalculator@gmail.com.

