

Table of Contents
Introduction
Have you ever wondered what percentage of your data falls below a certain value? A cumulative relative frequency calculator makes it easy to find the answer without complex calculations. This concept is useful for students, researchers, and anyone working with data. It helps you understand how values build up across a dataset using proportions or percentages instead of simple counts.
Many beginners confuse cumulative relative frequency with cumulative frequency. While they are closely related, they measure data in different ways. Knowing the difference can improve your understanding of statistics, surveys, business reports, and research results. It also makes charts and frequency tables much easier to interpret.
In this guide, you’ll learn how to calculate cumulative relative frequency step by step with simple formulas and worked examples. We’ll also explain when to use percentage cumulative frequency and show you how to calculate results instantly using our Cumulative Frequency Calculator, saving you time while improving accuracy.
What Is Cumulative Relative Frequency?
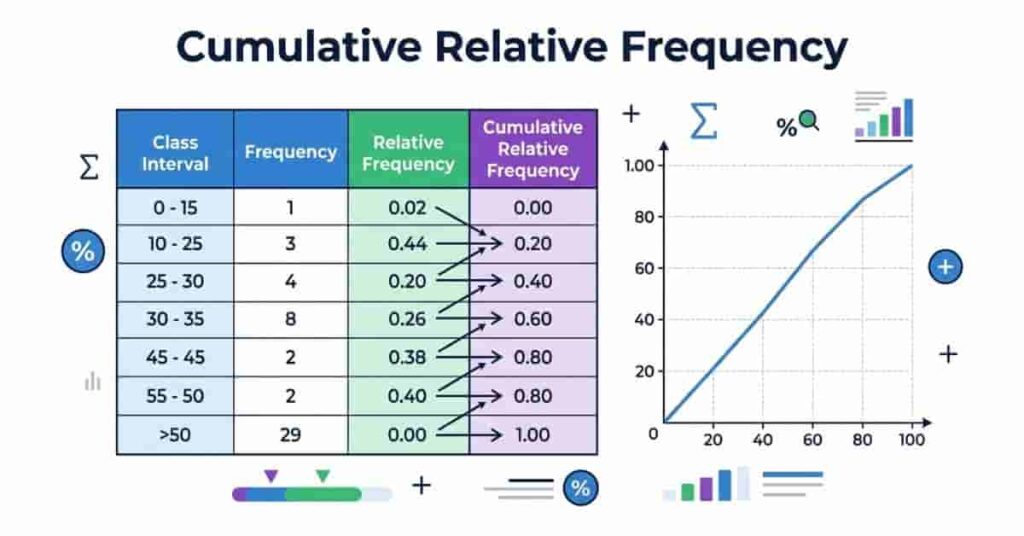
Cumulative relative frequency shows the running total of relative frequencies in a dataset. Instead of counting observations, it shows the proportion or percentage of values that fall at or below each class or category. This makes it easier to understand how data builds over time or across intervals.
Unlike cumulative frequency, which uses whole numbers, cumulative relative frequency uses decimals or percentages. The final value always equals 1.00 or 100%, confirming that all observations are included. This format helps readers compare datasets of different sizes without focusing on raw counts.
Whether you’re studying statistics, analyzing survey results, or reviewing business reports, cumulative relative frequency provides a clearer picture of data distribution. You can also calculate it quickly using a cumulative relative frequency calculator or a relative cumulative frequency calculator, saving time and reducing calculation errors.
Definition
Cumulative relative frequency is the running total of relative frequencies for a dataset. It tells you the proportion of observations that fall at or below each class interval. You calculate it by adding each relative frequency to the previous cumulative total.
For example, if the first two relative frequencies are 0.20 and 0.35, the cumulative relative frequency for the second class is 0.55. This means 55% of all observations fall within the first two classes.
Because it uses proportions instead of counts, cumulative relative frequency makes it easier to compare datasets with different sample sizes. That’s why many students and analysts prefer using a cumulative percent frequency calculator or similar statistical tools.
Pro Tip: If your final cumulative relative frequency is not 1.00 or 100%, check your calculations or rounding.
Why It Is Important
Cumulative relative frequency helps you understand how data accumulates across a distribution. Instead of looking at individual values, you can quickly see what percentage of observations fall below a certain point.
This makes graphs and frequency tables much easier to interpret. For example, teachers can see the percentage of students scoring below a target grade, while businesses can measure the percentage of orders completed within a specific time.
Before finding cumulative relative frequency, it is useful to understand how cumulative frequency is calculated from a frequency distribution.
When Is It Used?
Cumulative relative frequency has many practical applications because it shows how data builds across a dataset. It is commonly used whenever percentages provide more insight than simple frequencies.
Some common uses include:
- Statistics: Analyze data distributions and cumulative probability.
- Research: Compare participant responses across different groups.
- Surveys: Measure the percentage of responses below or above specific categories.
- Business Analytics: Track customer purchases, sales performance, or delivery times.
- Quality Control: Monitor the percentage of products meeting quality standards.
For example, a manufacturer may discover that 92% of products meet inspection requirements by reviewing cumulative relative frequency instead of individual counts. This approach makes reports easier to understand for managers and decision-makers.
Pro Tip: If you’re comparing datasets with different sample sizes, cumulative relative frequency provides a fair comparison because it uses proportions.
Relative Frequency vs Cumulative Relative Frequency
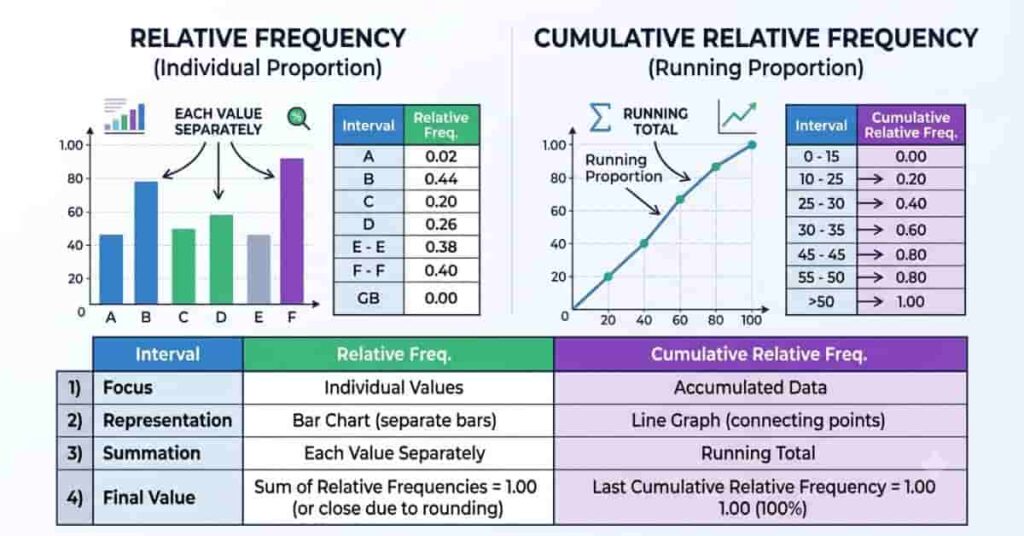
Relative frequency and cumulative relative frequency are closely related, but they answer different questions. Relative frequency shows the proportion for one class, while cumulative relative frequency shows the running proportion up to that class.
For example, a relative frequency of 0.20 means 20% of observations belong to one class. A cumulative relative frequency of 0.65 means 65% of all observations fall within that class and every class before it.
Understanding this difference helps you read frequency tables, cumulative graphs, and statistical reports more accurately. It also prevents confusion when using a cumulative relative frequency calculator or percentage cumulative frequency tools.
| Relative Frequency | Cumulative Relative Frequency |
|---|---|
| Individual proportion | Running proportion |
| Shows each value separately | Shows the running total of proportions |
| Calculated independently | Adds previous relative frequencies |
| Ends below or equal to 1 | Final value always equals 1.00 or 100% |
| Useful for individual categories | Useful for understanding overall distribution |
How to Calculate Relative Frequency
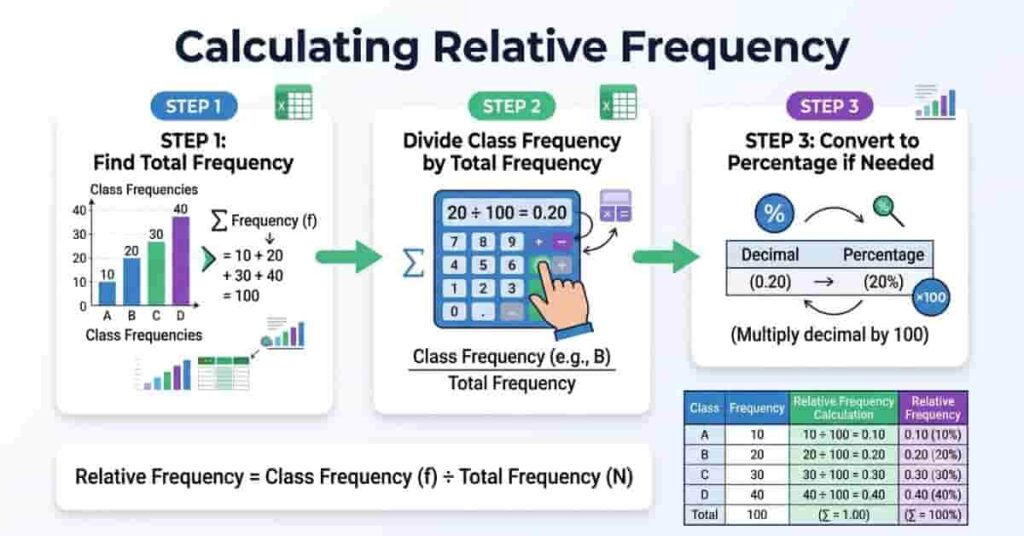
Calculating relative frequency is simple once you know the total number of observations. It tells you what fraction or percentage of the dataset belongs to each class. This value is the foundation for calculating cumulative relative frequency later.
If needed, multiply the result by 100 to express it as a percentage.
Step 1: Find the Total Frequency
Add all class frequencies together to find the total number of observations.
Example:
20 + 15 + 10 + 5 = 50
Step 2: Divide Each Class Frequency by the Total
Suppose one class has a frequency of 15.
Relative Frequency = 15 ÷ 50 = 0.30
Step 3: Convert to a Percentage (Optional)
Multiply the decimal by 100.
0.30 × 100 = 30%
Simple Worked Example
| Class | Frequency | Relative Frequency | Percentage |
|---|---|---|---|
| A | 20 | 0.40 | 40% |
| B | 15 | 0.30 | 30% |
| C | 10 | 0.20 | 20% |
| D | 5 | 0.10 | 10% |
| Total | 50 | 1.00 | 100% |
This table shows that every relative frequency represents a share of the total dataset. Together, all relative frequencies add up to 1.00 or 100%, making it easy to verify your calculations before finding cumulative relative frequency.
Once the running totals are calculated, you can organize them into a cumulative frequency table to make the distribution easier to interpret.
How to Calculate Cumulative Relative Frequency
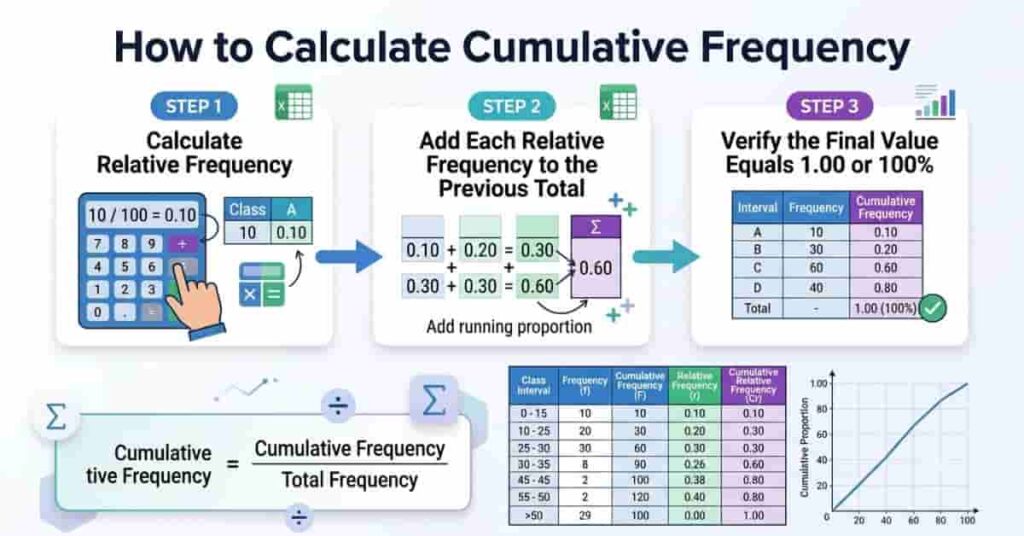
Calculating cumulative relative frequency is easier than it sounds. Once you know the relative frequency for each class, you simply keep a running total. The result shows the proportion or percentage of observations that fall at or below each class interval. A cumulative relative frequency calculator can perform these calculations instantly, but understanding the process helps you interpret statistical tables with confidence.
Formula
There are two common ways to calculate Cumulative Relative Frequency:
Method 1
Method 2
Step 1: Calculate the Relative Frequency
Find the relative frequency for each class using this formula: Relative Frequency=Total FrequencyClass Frequency
Suppose the total frequency is 20, and the first class has a frequency of 4.
Relative Frequency = 4 ÷ 20 = 0.20
Repeat this calculation for every class.
Step 2: Add Each Relative Frequency to the Previous Total
Start with the first relative frequency.
- First cumulative relative frequency = 0.20
- Second = 0.20 + 0.30 = 0.50
- Third = 0.50 + 0.25 = 0.75
- Continue until every class is included.
This running total shows how the dataset builds over each interval.
Step 3: Verify the Final Value
The last cumulative relative frequency should always equal 1.00 or 100%. If it does not, check your calculations or see whether you rounded numbers too early.
Expert Tip: Keep at least three or four decimal places during your calculations. Round only the final answers to avoid small errors.
Takeaways
- Calculate the relative frequency for every class first.
- Add each value to the previous cumulative total.
- The last cumulative relative frequency should equal 1.00 or 100%.
- Double-check totals before interpreting your results.
Worked Example: Cumulative Relative Frequency Table
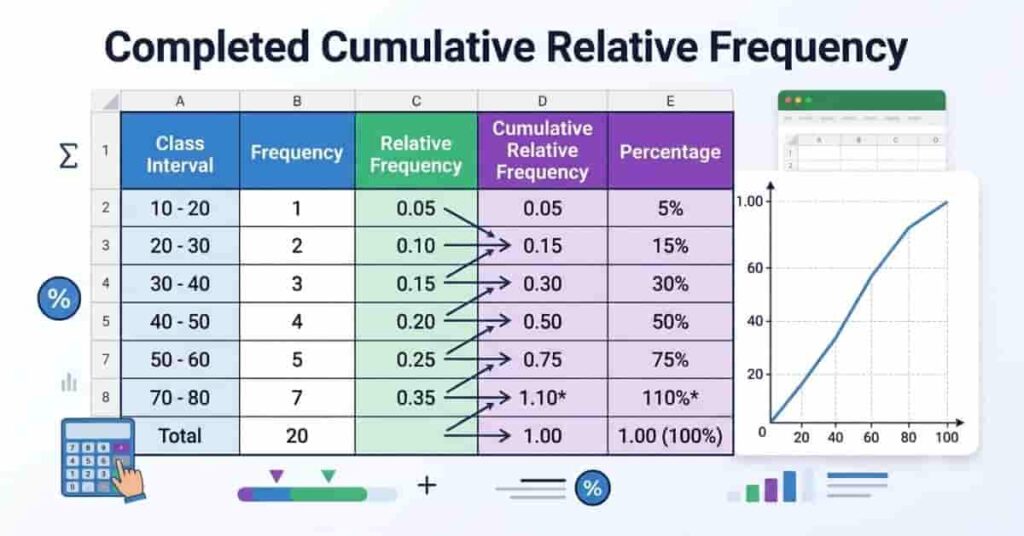
Let’s use a simple example to see how each value is calculated. Suppose a teacher records the scores of 25 students and groups them into class intervals.
| Class Interval | Frequency | Relative Frequency | Cumulative Relative Frequency | Percentage |
|---|---|---|---|---|
| 0–10 | 3 | 0.12 | 0.12 | 12% |
| 11–20 | 5 | 0.20 | 0.32 | 20% |
| 21–30 | 7 | 0.28 | 0.60 | 28% |
| 31–40 | 6 | 0.24 | 0.84 | 24% |
| 41–50 | 4 | 0.16 | 1.00 | 16% |
| Total | 25 | 1.00 | 1.00 | 100% |
Here’s how the calculations work:
- Step 1: Find the total frequency. In this example, the total is 25.
- Step 2: Divide each class frequency by 25 to find the relative frequency. For example, 7 ÷ 25 = 0.28.
- Step 3: Build the cumulative relative frequency by adding each new relative frequency to the previous total.
- First class: 0.12
- Second class: 0.12 + 0.20 = 0.32
- Third class: 0.32 + 0.28 = 0.60
- Fourth class: 0.60 + 0.24 = 0.84
- Fifth class: 0.84 + 0.16 = 1.00
The final cumulative relative frequency equals 1.00, which confirms that every observation has been included. If you prefer a faster method, a relative cumulative frequency calculator can generate the complete table automatically.
Percentage Frequency vs Relative Frequency
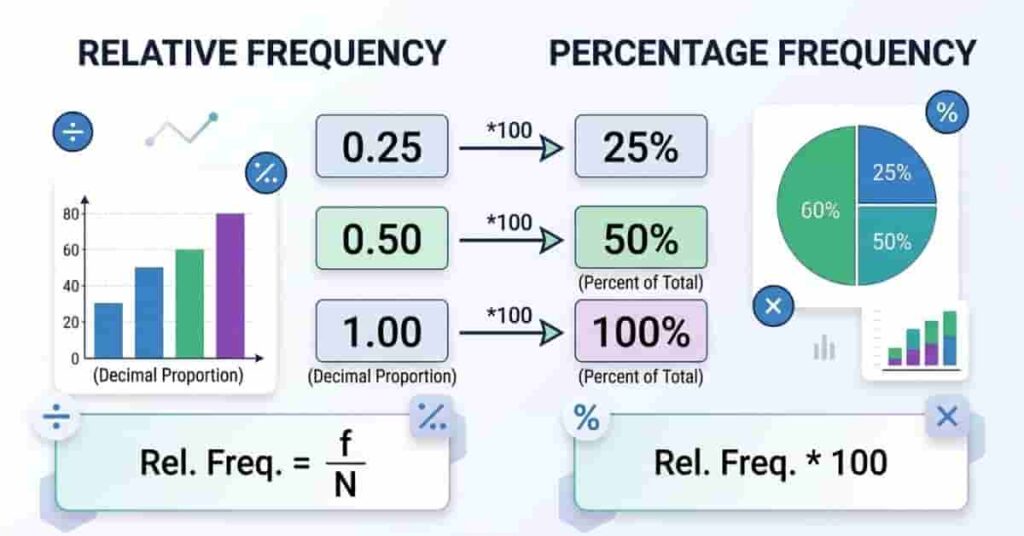
Relative frequency and percentage frequency describe the same information in different formats. Relative frequency uses decimal values, while percentage frequency expresses those decimals as percentages. Both help you understand how observations are distributed, but the best choice depends on your audience and reporting needs.
If you prefer working with spreadsheets, learn how to calculate cumulative frequency in Excel and build the running totals automatically.
Researchers and statisticians often use relative frequencies because decimals work well in formulas and probability calculations. Business reports, presentations, and survey summaries usually prefer percentages because they are easier for most readers to understand at a glance.
| Relative Frequency | Percentage Frequency |
|---|---|
| Decimal value | Percentage value |
| 0.25 | 25% |
| 0.50 | 50% |
| 1.00 | 100% |
Use relative frequency when performing statistical calculations, creating probability models, or working with formulas. Choose percentage frequency when presenting results to customers, students, managers, or general audiences.
Remember that both formats represent the same data. You can convert a relative frequency into a percentage by multiplying the decimal by 100. Likewise, divide a percentage by 100 to return to decimal form.
Common Mistakes When Calculating Cumulative Relative Frequency
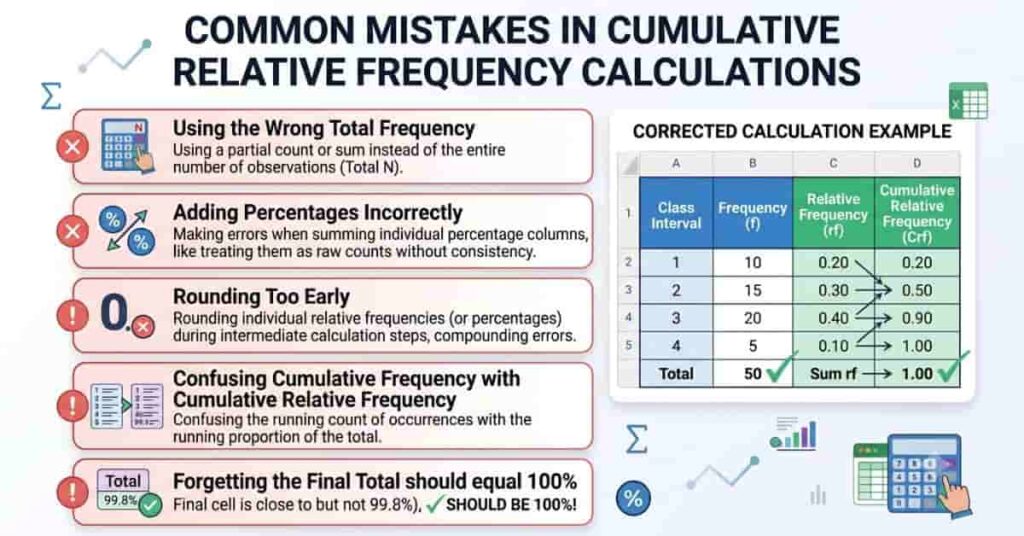
Even a simple calculation can produce incorrect results if you skip a step or use the wrong values. Knowing the most common mistakes will help you calculate cumulative relative frequency accurately and avoid confusion when reading statistical tables.
1. Using the Wrong Total Frequency
Always divide each class frequency by the total number of observations. Using the wrong total changes every relative frequency and leads to incorrect cumulative values.
2. Adding Percentages Incorrectly
If you’re working with percentages, add the percentage values exactly as they appear. Don’t mix percentages with decimal values in the same calculation. For example, adding 0.25 and 25% is incorrect because they use different formats.
3. Rounding Too Early
Rounding each relative frequency before finding the cumulative total can create small errors. Keep several decimal places during your calculations and round only the final results.
4. Confusing Cumulative Frequency with Cumulative Relative Frequency
Cumulative frequency is the running total of observations, while cumulative relative frequency is the running total of proportions or percentages. They measure the same dataset differently, so don’t use them interchangeably.
5. Forgetting the Final Total Should Equal 100%
The last cumulative relative frequency should always equal 1.00 or 100%. If it doesn’t, review your calculations, totals, and rounding.
Expert Tip: Before finishing, check whether all relative frequencies add up to 1.00. This simple step catches many common errors.
How to Use Our Cumulative Frequency Calculator
Calculating cumulative relative frequency by hand is a great way to learn, but it can take time for larger datasets. Our Cumulative Frequency Calculator simplifies the process by performing the calculations automatically. Whether you’re a student, teacher, or analyst, the tool helps you save time while reducing the chance of manual errors.
Follow these simple steps:
- Enter your dataset or frequency table.
- Generate the frequency distribution with one click.
- View the relative frequency for each class automatically.
- Calculate cumulative relative frequency instantly without manual addition.
- Copy or export the results for assignments, reports, or presentations.
The calculator also makes it easy to verify your manual work. After generating the results, check that the final cumulative relative frequency equals 1.00 or 100%. This quick validation helps ensure your calculations are correct.
If you’re learning statistics, try solving a problem by hand first. Then compare your answers with the calculator to build confidence and improve accuracy.
Applications of Cumulative Relative Frequency
Cumulative relative frequency is useful in many fields because it shows how data builds across a dataset. Instead of focusing on individual counts, it highlights the proportion of observations that fall below a specific value or class interval. This makes trends easier to understand and communicate.
Here are some common applications:
- Statistics: Analyze data distributions, create cumulative graphs, and interpret probability.
- Research: Compare participant responses and summarize study results using proportions.
- Education: Help students understand frequency distributions and cumulative percentages.
- Survey Analysis: Show the percentage of respondents selecting each category or below a specific rating.
- Business Reporting: Monitor sales, customer satisfaction, delivery times, and product performance.
- Probability Interpretation: Estimate the likelihood that an observation falls at or below a given value.
For example, a company might find that 85% of customer orders are delivered within three days by reviewing a cumulative relative frequency table. This insight is easier to understand than looking at individual delivery counts alone.
As datasets become larger, cumulative relative frequency becomes even more valuable. It helps identify patterns, compare groups, and support better decision-making in both academic and professional settings.
You can also use our Cumulative Frequency Calculator to generate the underlying cumulative totals before converting them into relative frequencies.
Conclusion
Understanding relative frequency and cumulative relative frequency becomes much easier when you follow the calculations step by step. You learned how to calculate relative frequencies, build cumulative totals, read frequency tables, and avoid common mistakes. A cumulative relative frequency calculator makes these tasks even faster while helping you verify your answers with confidence.
If you’re working with larger datasets, using a relative cumulative frequency calculator can save time and improve accuracy. It also makes it easier to interpret proportions and percentages across a dataset for assignments, research, or business reports.
Ready to simplify your calculations? Try our Cumulative Frequency Calculator for instant and accurate results. You can also explore our guides on How to Calculate Cumulative Frequency in Excel and How to Create a Cumulative Frequency Table to strengthen your statistics skills. If you found this guide helpful, share it with others or leave a comment below with your questions or feedback.
Frequently Asked Questions
What is cumulative relative frequency?
Cumulative relative frequency is the running total of relative frequencies in a dataset. It shows the proportion or percentage of observations that fall at or below each class interval. Unlike cumulative frequency, which uses counts, cumulative relative frequency uses decimals or percentages. The final value always equals 1.00 or 100%, indicating that all observations have been included.
How do you calculate cumulative relative frequency?
First, calculate the relative frequency for each class by dividing the class frequency by the total frequency. Next, add each relative frequency to the previous cumulative total. Continue until you reach the last class. The final cumulative relative frequency should equal 1.00 or 100%. You can also use a cumulative relative frequency calculator to generate the results instantly.
What is the difference between cumulative frequency and cumulative relative frequency?
Cumulative frequency is the running total of observations, while cumulative relative frequency is the running total of proportions or percentages. Cumulative frequency uses whole numbers, whereas cumulative relative frequency uses decimals or percentages. Cumulative relative frequency is especially useful for comparing datasets with different sample sizes.
Why does cumulative relative frequency always end at 1.00 or 100%?
The final cumulative relative frequency represents every observation in the dataset. Since all relative frequencies together make up the complete dataset, the cumulative total must equal 1.00 or 100%. If it does not, check your calculations, total frequency, or rounding.
How do you convert relative frequency into a percentage?
Multiply the relative frequency by 100. For example, a relative frequency of 0.35 becomes 35%. Percentages are often easier to understand in reports, surveys, and presentations, while still representing the same data.
Can cumulative relative frequency ever decrease?
No. Cumulative relative frequency can only increase or remain the same as you move through a frequency table because each class adds another proportion to the running total. The last value should always reach 1.00 or 100%.
How is cumulative relative frequency used in statistics?
Cumulative relative frequency helps analyze data distributions, estimate probabilities, create cumulative graphs (ogives), compare datasets, and identify trends. It is widely used in statistics, research, education, survey analysis, and business reporting.
Can Excel calculate cumulative relative frequency?
Yes. Excel can calculate cumulative relative frequency by first calculating the relative frequency for each class and then creating a running total with formulas. You can also use an online cumulative relative frequency calculator for faster and more accurate results.
Is there an online Cumulative Relative Frequency Calculator?
Yes. An online Cumulative Relative Frequency Calculator automatically calculates relative frequencies, cumulative relative frequencies, percentages, and frequency distributions. Simply enter your dataset or frequency table, and the calculator generates accurate results within seconds.
When should I use cumulative relative frequency instead of cumulative frequency?
Use cumulative relative frequency when you want to compare proportions or percentages instead of raw counts. It is ideal for comparing datasets with different sample sizes because percentages provide a fair comparison. Use cumulative frequency when you only need the running count of observations.
What is the formula for cumulative relative frequency?
You can calculate cumulative relative frequency in two ways. Divide the cumulative frequency by the total frequency, or add each relative frequency to the previous cumulative relative frequency.
Formula:
Cumulative Relative Frequency = Cumulative Frequency ÷ Total Frequency
OR
Current Relative Frequency + Previous Cumulative Relative Frequency
What is the difference between relative frequency and cumulative relative frequency?
Relative frequency shows the proportion of observations within a single class. Cumulative relative frequency shows the running proportion from the first class up to the current class. Relative frequency analyzes individual categories, while cumulative relative frequency helps you understand the overall distribution of the dataset.

Team ClassRank builds smart, student-friendly calculators to make grade and rank tracking simple and accurate. For questions or feedback, contact us at classrankcalculator@gmail.com.

