

Table of Contents
Introduction
Have you ever looked at a histogram and wondered why it has one peak—or suddenly two?
Understanding bimodal distribution vs unimodal shapes can make statistics much easier to read. These patterns appear in histograms, dot plots, and other graphs you may see in class.
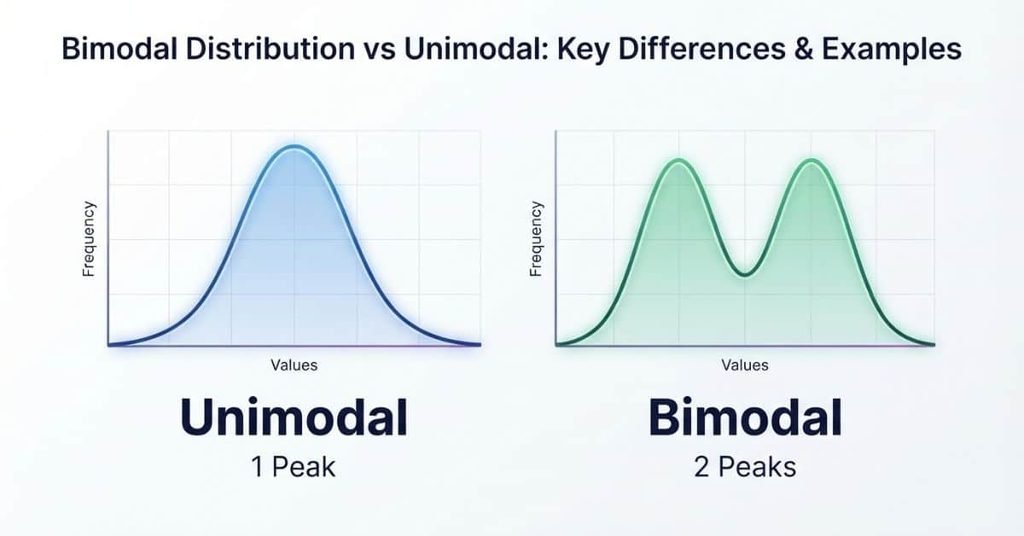
A unimodal distribution has one main peak, while a bimodal distribution has two distinct peaks. Recognizing these shapes can also help you understand how data may be grouped or spread across different values.
For beginners, the difference can seem small at first. However, identifying the correct distribution shape can change how you interpret a dataset.
In this guide, you’ll learn the difference between unimodal and bimodal distributions using simple definitions and examples. You’ll also see how each shape looks on a graph and histogram.
By the end, you’ll know how to identify whether data is unimodal or bimodal with greater confidence.
Bimodal Distribution vs Unimodal at a Glance
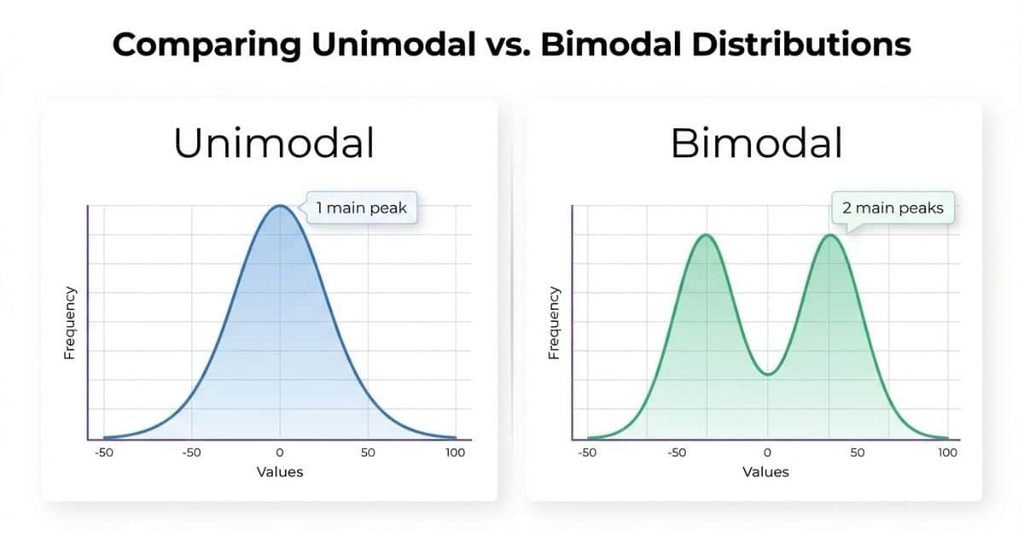
The key difference is simple: a unimodal distribution has one prominent peak, while a bimodal distribution has two prominent peaks.
| Feature | Unimodal | Bimodal |
|---|---|---|
| Number of prominent peaks | One | Two |
| Main clusters | One | Two |
| Typical shape | One main hump | Two main humps |
| Possible underlying groups | Usually one dominant group | Often two groups |
| Example | One population’s test scores | Combined data from two groups |
A unimodal distribution often shows one central concentration of values. A bimodal distribution shows two separate concentrations. These patterns can help students describe the overall shape of data.
However, a graph’s visual peaks do not automatically identify the statistical mode. The mode refers to the most frequently occurring value, while a peak describes a concentration in the distribution.
What Is a Unimodal Distribution?
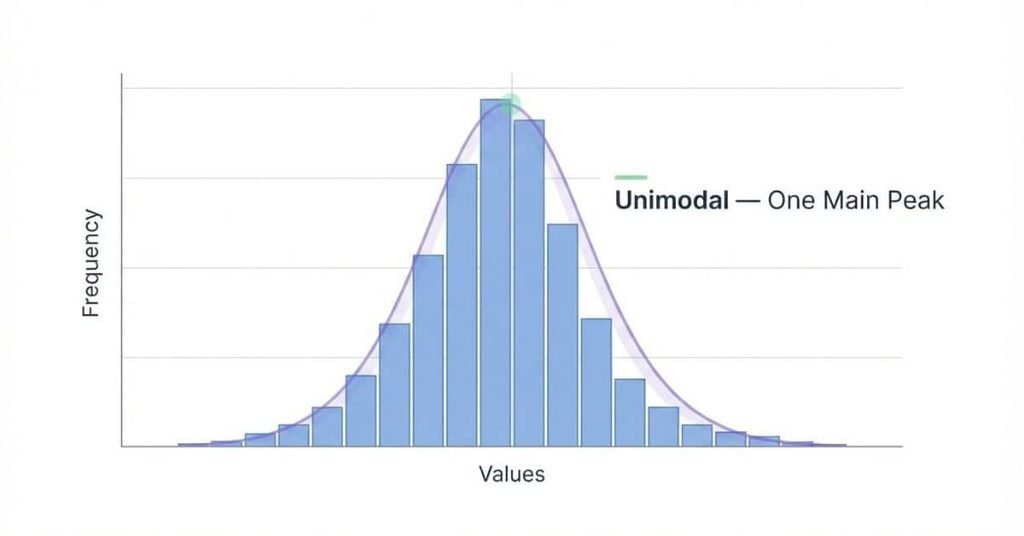
A unimodal distribution is a distribution with one prominent peak or main concentration of values. The prefix “uni” means one, which makes the term easier to remember.
When you examine unimodal data, most values tend to gather around one main area. The graph usually rises toward this area and then falls away from it. The exact shape can vary, so a unimodal distribution does not need to look perfectly symmetrical.
A visual peak and the statistical mode are related but aren’t always identical. The mode is the value that occurs most often. A peak on a histogram represents an area where values are concentrated. For grouped data, several nearby values can create one broad visual peak.
Common examples include test scores from one class, heights within a similar population, or daily temperatures over a selected period. These datasets can appear unimodal when most observations form one main cluster.
On a graph, a unimodal distribution typically looks like one main hump. The hump may be narrow, wide, symmetric, or somewhat skewed.
What Does a Unimodal Graph Look Like?
A unimodal graph has one clearly identifiable main hump. Values become more concentrated as the graph approaches the peak. They then become less common as the graph moves away from that area.
For example, imagine student test scores ranging from 50 to 100. If most students score around the same range, the graph may form one main peak.
The peak does not have to appear exactly in the center. A unimodal distribution can also lean toward one side. What matters is that the graph has one main concentration rather than two distinct peaks.
Unimodal Histogram Example
Consider these simplified test scores from a student group:
72, 75, 78, 79, 80, 81, 82, 83, 84, 86, 88
Most scores cluster around the upper 70s and 80s. A histogram of these scores would likely show one main concentration.
That concentration represents the central cluster of the unimodal data. The histogram may have small variations between bars, but the overall pattern remains focused around one area.
What Is a Bimodal Distribution?
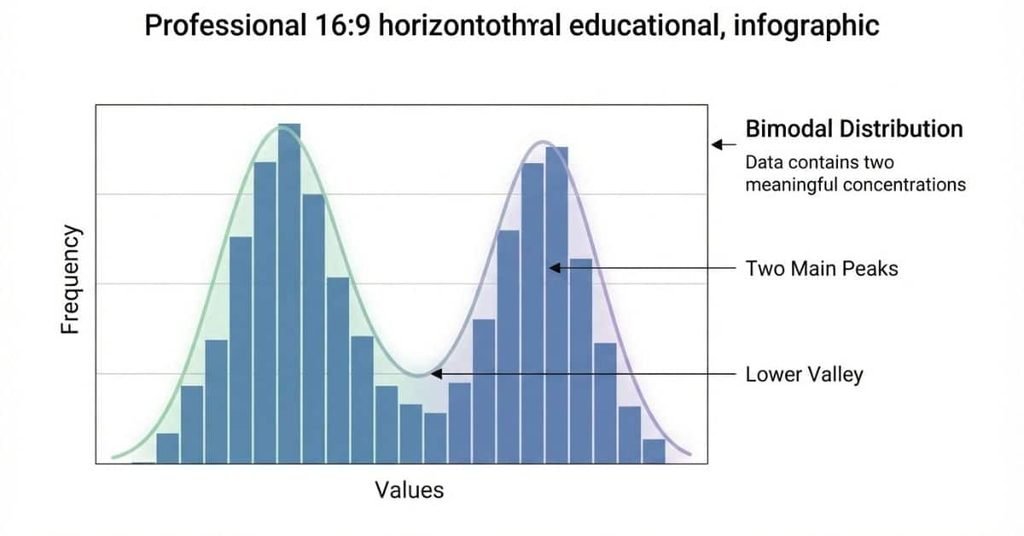
A bimodal distribution has two prominent peaks or main concentrations of values. The prefix “bi” means two, which makes the term easy to remember.
In bimodal data, values tend to gather around two different areas. Each area creates a noticeable peak on a graph or histogram. The peaks may have similar heights, but they don’t need to be identical.
Two peaks can appear for several reasons. The dataset may combine observations from two different groups, populations, or processes. For example, test scores from two different classes could create two clusters if the classes perform differently.
A bimodal distribution does not automatically prove that two groups exist. Other features of the data can also produce two peaks. You should examine the dataset and its context before deciding why the pattern appears.
What Does a Bimodal Graph Look Like?
A bimodal graph typically has two distinct humps. A lower point or valley often separates the two peaks.
For example, imagine a dataset containing measurements from two groups. If each group forms its own concentration, the graph may show two separate peaks.
The two peaks don’t need to have the same height. One cluster can contain more observations than the other.
Bimodal Histogram Example
Consider these simple test scores from two student groups:
62, 64, 65, 67, 68, 82, 84, 85, 87, 89
The first five scores cluster around the mid-60s. The remaining scores cluster around the mid-80s.
A histogram of these bimodal data would likely show two separate peaks. The first peak represents the lower score cluster. The second peak represents the higher score cluster.
This pattern could occur when a dataset combines students from two groups with different score patterns. The histogram itself shows the distribution, but additional context helps explain why two clusters appear.
What Is the Difference Between Unimodal and Bimodal?
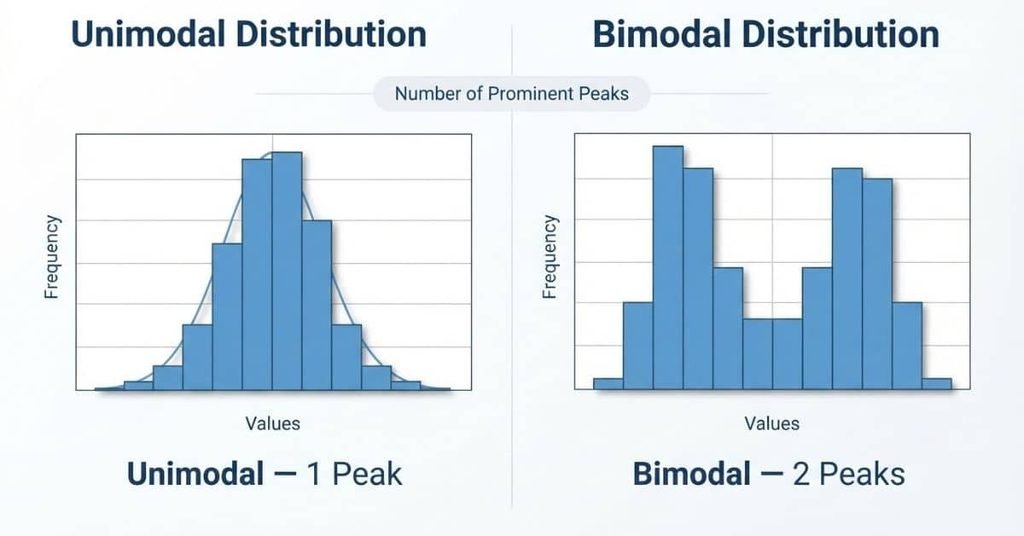
The main difference in bimodal distribution vs unimodal data is the number of prominent peaks. A unimodal distribution has one main peak, while a bimodal distribution has two.
This difference also affects how you interpret the data’s clusters and overall shape. A single peak often shows one dominant concentration. Two peaks can indicate separate concentrations that deserve further investigation.
The bimodal vs unimodal distribution comparison becomes easier when you focus on four features: peaks, clusters, possible groups, and visual shape.
Number of Peaks
A unimodal distribution has one prominent peak. A bimodal distribution has two prominent peaks.
Think of the peaks as high points on the distribution. One main high point suggests a unimodal shape. Two distinct high points suggest a bimodal shape.
Small bumps don’t always create a true bimodal pattern. Look for two meaningful concentrations rather than counting every minor variation.
Number of Clusters
Unimodal data usually has one main cluster of values. Bimodal data has two main clusters.
For example, scores such as 72, 75, 78, 80, and 82 form one general concentration. Scores such as 62, 65, 67 and 84, 86, 88 create two separate concentrations.
Clusters provide useful context because they show where observations gather.
What the Shape May Tell You
A unimodal shape may suggest that one dominant group or process produces most observations. A bimodal shape can suggest that two groups or populations contribute to the dataset.
For example, combining measurements from two different classes may produce two peaks. One class could form the lower cluster, while another forms the higher cluster.
Still, a bimodal distribution does not prove that two populations caused the pattern. You need context and further analysis to identify the underlying reason.
How the Graph Looks
The visual difference between unimodal vs bimodal distribution is straightforward. A unimodal graph has one main hump. A bimodal graph has two main humps.
| Shape | Visual Pattern | Main Interpretation |
|---|---|---|
| Unimodal | One main hump | One dominant concentration |
| Bimodal | Two main humps | Two distinct concentrations |
When deciding unimodal or bimodal, first look for the number of meaningful peaks. Then check whether those peaks represent clear clusters.
Quick tip: Don’t rely only on peak height. Examine the full distribution and the context behind the data.
Bimodal Distribution vs Unimodal Distribution Examples
Real-world examples make the difference between these shapes easier to recognize. The same type of measurement can look different when groups change.
Example 1 — Test Scores
Data: Imagine one class has these test scores: 72, 75, 77, 79, 80, 82, 84, 86, and 88. Most scores fall within one general range.
Graph: A histogram of these scores would show one main concentration of bars.
Shape: Unimodal.
Explanation: One class can produce a unimodal pattern when its scores form one dominant cluster. Now imagine combining that class with another class whose scores mostly fall between 55 and 68. The combined dataset could produce two clusters and potentially become bimodal.
The second pattern doesn’t automatically prove that the classes caused the peaks. The group labels and original data provide important context.
Example 2 — Heights
Data: Suppose researchers combine height measurements from two populations with noticeably different typical heights.
Graph: A histogram of the combined measurements may show one concentration for each population.
Shape: Potentially bimodal.
Explanation: Each population can contribute a separate cluster. When the two clusters are far enough apart, the combined histogram may show two prominent peaks.
This example shows why context matters when interpreting a bimodal distribution. A single dataset can contain observations from multiple groups.
Example 3 — Study Time
Data: Consider students who report their weekly study hours. Some students study for fewer hours, while another group studies much more.
Graph: A histogram could show one cluster among lower study times and another among higher study times.
Shape: Potentially bimodal.
Explanation: Two study-time clusters may create a bimodal histogram. The pattern could reflect different study habits, schedules, or other factors.
These examples show the key idea behind bimodal distribution vs unimodal data: one dominant cluster often creates one peak, while two distinct clusters can create two.
How to Tell If a Distribution Is Unimodal or Bimodal
Use this simple process when deciding whether a graph is unimodal or bimodal.
Step 1: Look at the Overall Shape
First, examine the entire graph rather than focusing on one bar or point. Notice where the data becomes concentrated and where it spreads out.
Step 2: Count the Prominent Peaks
Look for meaningful high points in the distribution. One prominent peak suggests a unimodal shape. Two prominent peaks suggest a bimodal shape.
Step 3: Look for Clusters
Check whether values form one main group or two separate groups. Clear clusters provide stronger evidence than isolated high or low values.
Step 4: Check the Valley Between Peaks
For a possible bimodal distribution, examine the area between the two peaks. A noticeable drop can separate the clusters.
The valley does not need to reach zero. The important question is whether two meaningful concentrations stand apart.
Step 5: Consider the Context
Finally, ask where the data came from. Two peaks may suggest different groups, populations, or processes contributed to the observations.
Don’t classify a distribution based on tiny random bumps alone. Small fluctuations can occur naturally in sample data. Focus on prominent peaks and meaningful clusters instead.
Pro Tip: If you’re unsure, compare the graph with the raw data and ask what could explain the observed pattern.
Unimodal vs Bimodal Histograms
Histograms make distribution shapes easy to compare because the bars show where observations concentrate. A unimodal histogram has one dominant peak, while a bimodal histogram has two.
The first curve represents a single main concentration. The second curve shows two distinct concentrations. This visual difference is the main idea behind a unimodal vs bimodal histogram comparison.
Unimodal Histogram
A unimodal histogram has one dominant peak. The bars generally rise toward one main area and then decrease.
The peak may appear near the center or closer to one side. It can also be narrow, wide, symmetric, or skewed.
When you examine a histogram, focus on the overall pattern. Don’t assume every small change in bar height represents a separate mode.
Bimodal Histogram
A bimodal histogram has two dominant peaks. These peaks represent two noticeable areas where observations concentrate.
A lower region often appears between the peaks. This valley helps separate the two clusters visually.
For example, combined test scores from two groups may create two peaks. Each group could contribute one concentration to the overall histogram.
Can a Histogram Have Two Peaks but Not Be Meaningfully Bimodal?
Yes. A histogram can show a small bump without having a meaningful second mode.
Sample data often contains minor fluctuations. One bar may rise slightly above nearby bars because of ordinary variation.
For this reason, don’t label a distribution bimodal simply because you notice two small high points. Look for two prominent and meaningful concentrations.
The bin width can also affect how a histogram looks. Changing the bin width may make small bumps appear or disappear.
Consider the overall shape, the size of each cluster, and the context of the data before calling it bimodal.
Unimodal vs Bimodal Dot Plots
Dot plots show individual observations as dots stacked above their values. They can display the same distinction as histograms.
A unimodal dot plot has one main concentration of dots. A bimodal dot plot has two noticeable concentrations separated by a lower-density area.
Unimodal Dot Plot
In a unimodal dot plot, most dots gather around one general range. The stack usually becomes taller toward one central area.
For example, student quiz scores might cluster around the same score range. That pattern can produce one dominant concentration.
The exact shape doesn’t need to be perfectly balanced. A skewed dot plot can still be unimodal if it has one main concentration.
Bimodal Dot Plot
A bimodal dot plot has two noticeable concentrations of dots. You can often see a gap or lower-density region between them.
In this example, the dots form two separate groups. The first group sits around the lower values, while the second group appears around higher values.
That visual separation makes the pattern potentially bimodal. As with histograms, context matters before assigning the final description.
Does a Bimodal Distribution Need a Gap?
No, a bimodal distribution does not need a complete gap between its two peaks.
A visible gap can make two groups easier to recognize. However, observations can still appear between the peaks without removing the bimodal pattern.
The key feature is the presence of two meaningful concentrations. Each concentration should create a noticeable peak in the overall distribution.
Imagine a dataset with many values around 60 and many values around 80. A few observations may fall between those areas. The graph can still show two prominent peaks.
The valley between the peaks may therefore be shallow rather than completely empty. You should examine the entire shape instead of looking for a perfect gap.
This distinction matters when interpreting real datasets. Natural data rarely forms perfectly separated groups. Small amounts of overlap can occur between populations or groups.
Pro Tip: Focus on the strength and separation of the two peaks, not whether the middle contains zero observations.
Unimodal, Bimodal, and Multimodal Compared
Unimodal and bimodal distributions are part of a broader way to describe distribution shapes. The terms mainly differ by the number of prominent peaks.
| Distribution | Prominent Peaks |
|---|---|
| Unimodal | 1 |
| Bimodal | 2 |
| Multimodal | More than 2 |
A unimodal distribution has one prominent peak. A bimodal distribution has two prominent peaks. A multimodal distribution has more than two prominent peaks.
The term multimodal acts as the broader category for distributions with multiple modes or prominent concentrations. A bimodal distribution is therefore a specific type of multimodal distribution.
For example, a dataset with three distinct concentrations may have a multimodal shape. A dataset with four prominent concentrations can also be described as multimodal.
The bimodal vs multimodal distinction helps you describe complex data more precisely. If there are exactly two prominent peaks, bimodal gives more specific information. If there are more than two, multimodal describes the broader pattern.
As always, focus on meaningful peaks rather than tiny random fluctuations. The overall distribution and data context should guide your description.
Can a Distribution Be Both Bimodal and Symmetric?
Yes. A distribution can be both bimodal and symmetric. These terms describe different features of a dataset.
Bimodal describes the number of prominent peaks. Symmetric describes how the data balances around its center.
For example, imagine two equally sized clusters placed at similar distances from the center. A graph could show two matching peaks on opposite sides. The overall shape would be both bimodal and symmetric.
However, a bimodal distribution does not automatically have symmetry. One peak may be taller than the other. One cluster may also sit farther from the center.
Think of these descriptions as separate questions. First, ask how many meaningful peaks appear. Then ask whether the distribution balances around its center.
This distinction helps avoid a common mistake. Seeing two peaks tells you about modality, not automatically about symmetry.
Pro Tip: Count the prominent peaks first, then examine whether the left and right sides show a balanced pattern.
Why Do Bimodal Distributions Occur?
A bimodal distribution often appears when different groups or conditions contribute separate clusters of observations. Understanding the possible cause can make the graph easier to interpret.
Two Different Populations
Two different populations can produce two distinct clusters. For example, researchers could measure heights from two populations with different typical height ranges.
When combined, the measurements may form two prominent peaks. The resulting graph can therefore look bimodal.
Combining Two Groups
Combining two groups with different patterns can also create bimodal data. Imagine two classes taking the same exam.
If one class generally scores lower and the other generally scores higher, their combined scores could show two clusters. Each class may contribute one peak.
However, the actual data must show sufficient separation before calling the combined distribution bimodal.
Different Behaviors
Different behaviors can produce separate concentrations. Consider students’ weekly study hours.
One group may study a few hours each week, while another group studies substantially longer. Their combined responses could create two noticeable clusters.
The peaks may reflect different study habits rather than one typical behavior.
Different Conditions or Subgroups
Different conditions can also influence how observations are distributed. For example, students might complete a task under two different schedules.
One subgroup could produce lower completion times, while another produces higher times. Combining the observations may create two concentrations.
In each case, the graph shows the pattern, while the context helps explain why that pattern may exist.
How to Describe Unimodal and Bimodal Distributions in AP Statistics
In AP Statistics, identifying a distribution’s shape is only part of your response. You also need to describe the center, spread, outliers, and context. A useful structure is:
Shape → Center → Spread → Outliers → Context
Start with the overall shape. State whether the distribution is unimodal, bimodal, symmetric, skewed, or another appropriate shape. If you see two clear peaks, describe the distribution as bimodal.
Next, describe the center using a value or reasonable estimate. For a unimodal distribution, the center may fall near the main peak. For a bimodal distribution, mention both clusters when one center would hide important information.
Then describe the spread. Use the range, IQR, standard deviation, or another measure when the problem provides enough information. Identify unusual values or possible outliers separately.
Finally, connect your description to the variable and population. This context step matters in AP Statistics because it shows that you understand what the data represents.
A strong response should describe the graph rather than simply label it. For example, instead of writing “The graph is bimodal,” explain that it has two distinct clusters and identify what those clusters represent.
Sample AP Statistics Response — Unimodal
Suppose a histogram shows the number of hours students studied for an AP Statistics test. Most students studied between 4 and 7 hours, with one clear peak near 5 hours.
Model response:
The distribution of study time is unimodal and slightly right-skewed. The center is about 5 hours, with most students studying between 4 and 7 hours. The spread is approximately 2 to 10 hours. There appears to be one unusually high value near 10 hours. In context, most students studied about 5 hours for the AP Statistics test.
This response follows the full structure without adding unnecessary detail.
Sample AP Statistics Response — Bimodal
Suppose a histogram shows the commute times of students at a school. One group lives nearby, while another group travels much farther.
Model response:
The distribution of student commute times is bimodal, with peaks near 15 and 45 minutes. The two clusters represent students with shorter and longer commutes. The overall spread is about 10 to 55 minutes, with no obvious outliers. In context, the data suggest two common commute-time groups among the students.
Notice that the response does not force one overall center. The two peaks provide more useful information than a single middle value.
Common Mistakes Students Make
Students often recognize the basic difference between unimodal and bimodal distributions but lose accuracy when interpreting real graphs. These mistakes can also lead to incomplete AP Statistics responses.
Mistake 1: Counting Every Small Bump as a Mode
A graph can contain small rises and dips without being meaningfully multimodal. Random variation, measurement noise, or histogram bin choices can create minor bumps.
Focus on prominent peaks and meaningful clusters. A second mode should stand out enough to support your description.
Mistake 2: Thinking a Gap Is Required for Bimodality
A bimodal distribution does not need a completely empty space between its peaks. The two groups may overlap.
Look for two clear concentrations separated by a noticeable valley. Don’t require every value between the peaks to disappear.
Mistake 3: Confusing Bimodal With Symmetric
Bimodal describes the number of prominent peaks. Symmetry describes how the distribution balances around its center.
A distribution can be bimodal and symmetric, bimodal and asymmetric, or neither. Always describe these features separately.
Mistake 4: Assuming Two Groups Always Produce a Bimodal Distribution
Two underlying groups do not automatically create two visible peaks. If their values overlap heavily, the combined distribution may look unimodal.
Use the graph itself as evidence. Then use context to explain why separate clusters might exist.
Mistake 5: Confusing Bimodal With Multimodal
Bimodal means the distribution has two prominent peaks. Multimodal refers to distributions with more than two prominent peaks.
So, a distribution with three or four meaningful peaks may be multimodal rather than bimodal.
Mistake 6: Ignoring Context
A graph description becomes stronger when you explain what the peaks or clusters represent.
For example, don’t stop at “The distribution is bimodal.” If the data involve commute times, explain what the two groups may represent in that context.
AP Statistics tip: Describe the graph first, then connect its features to the real-world variable. This approach helps keep your answer specific and evidence-based.
Quick Practice — Is It Unimodal or Bimodal?
Try these five quick examples before checking the answers. Focus on the overall shape, not every small change in the data.
Example 1: Quiz Scores
Mini data:
72, 74, 75, 76, 77, 78, 79, 80, 81, 83, 84
Question: Is this distribution unimodal or bimodal?
Answer: Unimodal
Why: The values form one main concentration around the upper 70s. There are no two clearly separated peaks.
Example 2: Commute Times
Mini data:
10, 12, 13, 14, 15, 16, 17, 38, 40, 42, 43, 45, 47
Question: Is this distribution unimodal or bimodal?
Answer: Bimodal
Why: The data form two distinct clusters. One centers around the mid-teens, while the other centers around the low 40s.
Example 3: Daily Study Hours
Mini data:
1, 2, 2, 3, 3, 3, 4, 4, 5, 5, 6
Question: Is this distribution unimodal or bimodal?
Answer: Unimodal
Why: Most observations gather around 3–4 hours. Small rises in frequency do not create a second meaningful peak.
Example 4: Two Score Clusters
Mini data:
61, 63, 64, 65, 67, 82, 83, 85, 86, 88
Question: Is this distribution unimodal or bimodal?
Answer: Bimodal
Why: The values create two strong clusters, one in the 60s and another in the 80s. The separation makes two peaks meaningful.
Example 5: A Graph With a Small Bump
Mini data:
5, 6, 6, 7, 7, 8, 8, 8, 9, 9, 10, 10, 11
Question: Is this distribution unimodal or bimodal?
Answer: Unimodal
Why: The data have one main concentration around 8–10. Minor changes in frequency do not automatically create another mode.
AP Statistics Quick Tip
When you practice, ask yourself three questions:
- How many prominent peaks do I see?
- Are there two meaningful clusters?
- Could a small bump simply be random variation?
One clear peak suggests unimodal. Two meaningful peaks suggest bimodal. Don’t count every tiny bump as a separate mode.
Conclusion
Understanding bimodal distribution vs unimodal becomes easier when you focus on the number of meaningful peaks. A unimodal distribution has one main peak, while a bimodal distribution has two. We also covered graphs, histograms, examples, AP Statistics descriptions, and common mistakes.
Remember to consider the entire shape before labeling a distribution. Small bumps don’t always represent additional modes. Context can also help explain why separate clusters appear in the data.
With practice, identifying unimodal and bimodal distributions becomes much more natural. Use the examples in this guide to test your understanding before your next statistics assignment or AP exam.
Ready to practice? Explore more statistics resources on our website and build confidence with each problem.
Frequently Asked Questions
Find clear answers to common questions about unimodal and bimodal distributions.

Team ClassRank builds smart, student-friendly calculators to make grade and rank tracking simple and accurate. For questions or feedback, contact us at classrankcalculator@gmail.com.