
Choose Calculation Type

First, select whether you want to calculate for a single interval or multiple intervals.
Use Single Interval for one class
Use Multiple Intervals for grouped data
📌 This helps you work faster based on your problem type.
Enter Class Limits

Enter your class interval values:
Lower Class Limit (e.g., 60)
Upper Class Limit (e.g., 69)
📌 Make sure your values are correct to avoid wrong results.
Set Boundary Adjustment
![]()
Choose the correct boundary adjustment value:
Use 0.5 for whole numbers
Use 0.05 for decimal values
📌 This step is very important because it removes gaps between classes.
Click Calculate Button
![]()
Click the “Calculate Boundaries” button to process your data.
📌 The calculator will instantly apply the formula and generate results.
View Class Boundaries Results
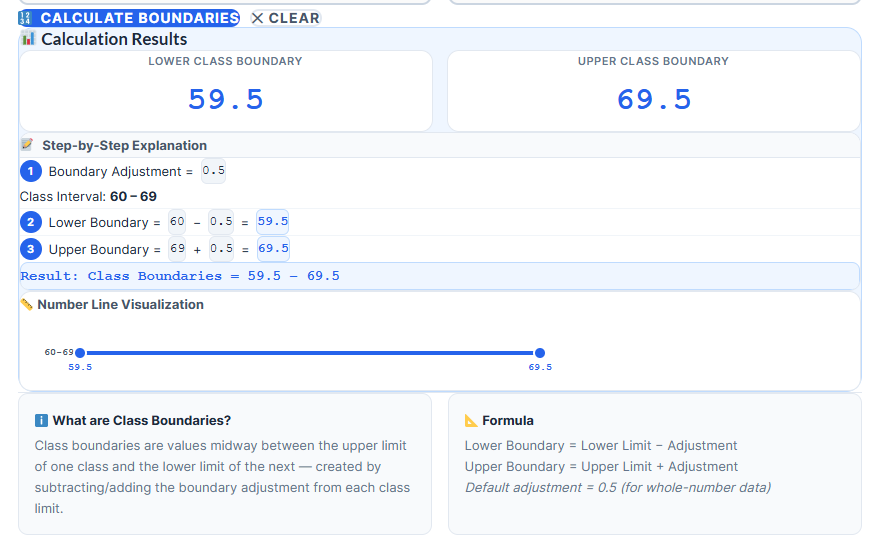
You will see the final results:
Lower Class Boundary (e.g., 59.5)
Upper Class Boundary (e.g., 69.5)
📌 These values represent the real limits of your class interval.
Understand Step-by-Step Solution
Check the detailed explanation:
Shows subtraction and addition clearly
Helps you learn the method
📌 This is useful for exams and concept clarity.
View Number Line Visualization
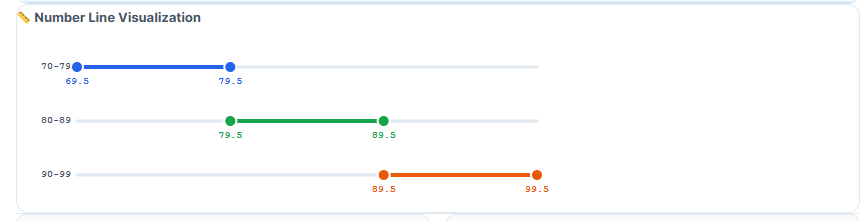
See how boundaries work visually on a number line.
📌 This helps you understand how gaps are removed between classes.
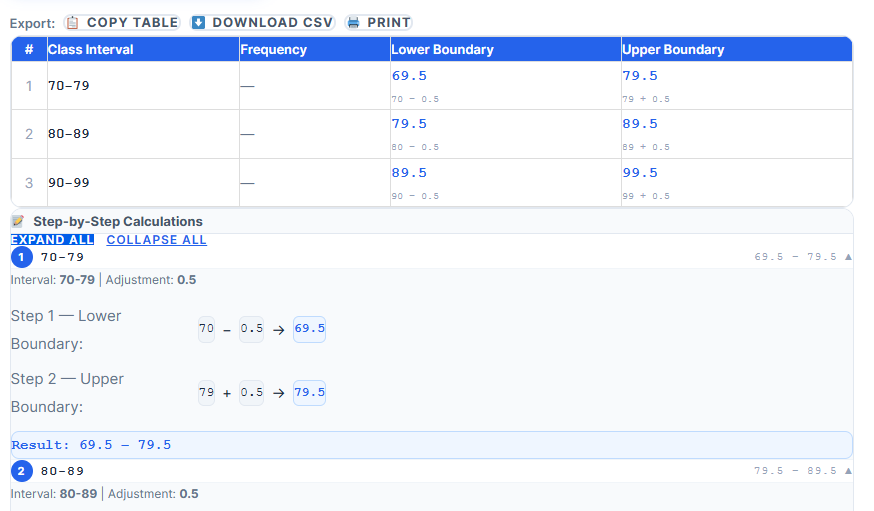
Use Multiple Intervals
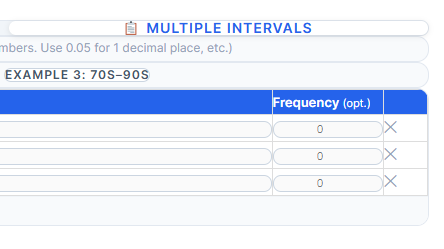
If you have grouped data:
Add multiple class intervals
Click “Calculate All Boundaries”
Get results for all classes together
📌 This saves time for large datasets.