
Introduction
Confused why class intervals like 10–20 don’t fully connect on graphs?
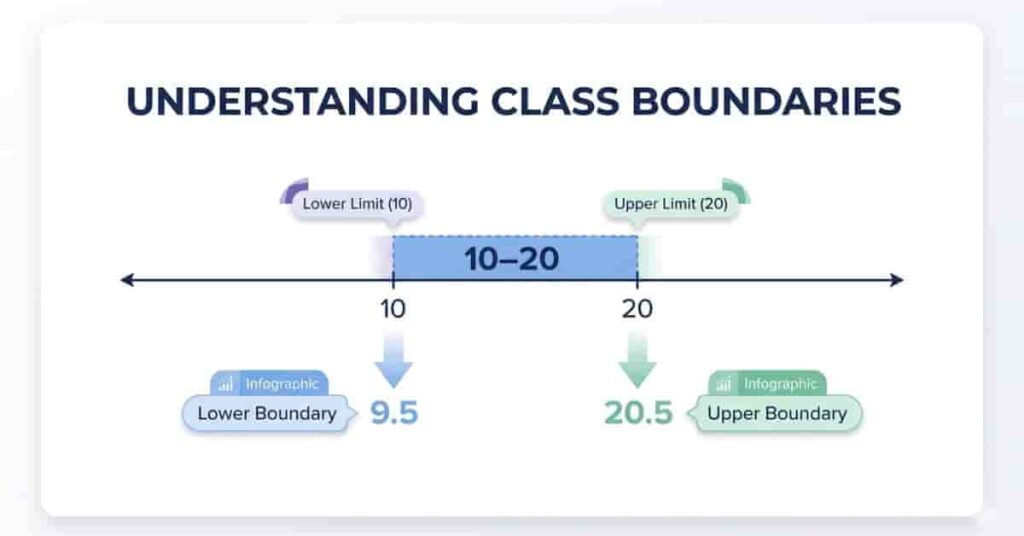
Lower and upper class boundaries address this problem by clearly defining the true limits of each class interval. Many beginners in the USA struggle with gaps in grouped data. This often leads to errors in histograms and frequency distributions. Understanding each lower-class boundary and upper-class boundary helps you avoid these mistakes.
In simple terms, boundaries adjust class limits slightly. The lower boundary is slightly smaller, and the upper boundary is slightly larger. This removes gaps, making your data continuous and accurate.
In this guide, you’ll learn how to find lower and upper class boundaries step by step. You’ll also see clear examples and common mistakes to avoid. By the end, you’ll feel confident solving questions and using this concept in exams or real data analysis.
👉 If you want quick results, try our class boundaries calculator to save time and avoid errors.
📌 What is the Lower Class Boundary?
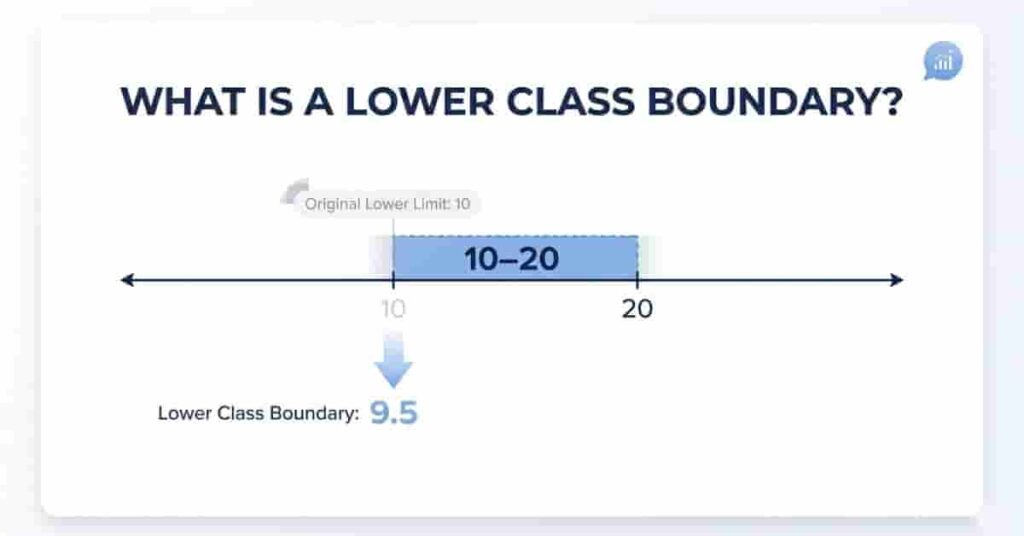
The lower class boundary is the smallest value included in a class interval. Consequently, it marks the true start of a class, thus removing gaps between classes and making data continuous.
In most cases, you find the lower class boundary by subtracting a small value from the lower class limit. Specifically, for whole-number grouped data, this value is usually 0.5. As a result, this adjustment ensures that no values are omitted between classes.
For example, with a class limit of 10–20, the lower boundary is 9.5. This includes values just below 10 and smoothly connects classes.
This concept is crucial when drawing graphs, such as histograms. Without boundaries, data may show gaps or errors.
“To understand the full process, follow this complete step-by-step guide to class boundaries.”
Quick Tip: Always check your data type, and use 0.5 only when class limits are whole numbers.
🧠 Key Takeaways
- The lower class boundary is the true starting value of a class.
- It is slightly less than the lower class limit.
- You usually subtract 0.5 to calculate it.
- It helps make grouped data continuous and accurate.
📌 What is the Upper Class Boundary?
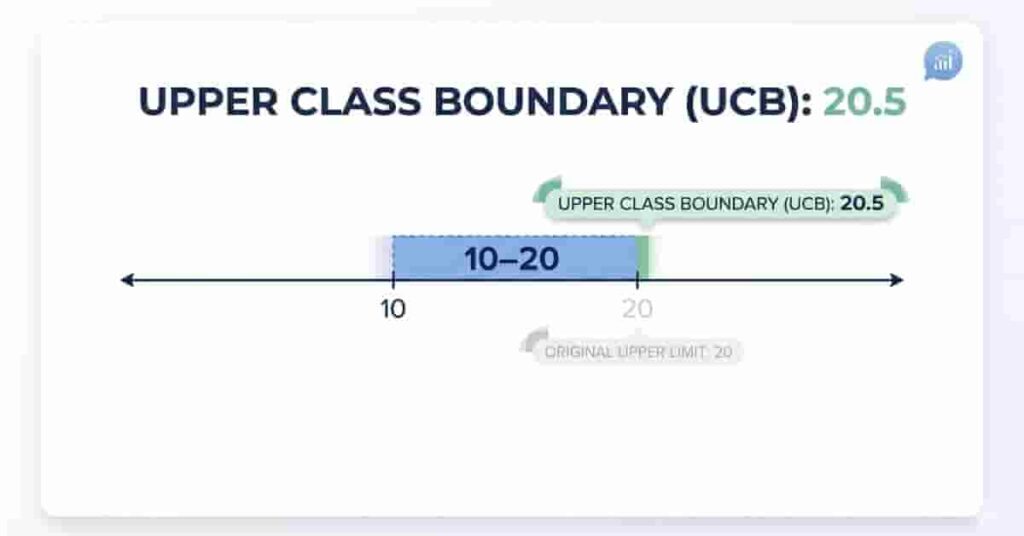
The upper class boundary in statistics is the highest value that can be included in a class interval. It shows the true ending point of a class. This helps remove gaps and keeps your grouped data continuous.
To find the upper class boundary, you add a small value to the upper class limit. For whole-number data, this value is usually 0.5. This small increase ensures that values at the edge are included correctly.
For example, if the class limit is 10–20, the upper class boundary becomes 20.5. Now, values just above 20 are handled properly. This creates a smooth link between adjacent classes.
This concept is very useful when drawing histograms or frequency graphs. Without boundaries, your graph may show gaps or incorrect bars.
👉 Quick Tip: Use the same adjustment value across all classes to keep results consistent.
📉 Formula for Lower and Upper Class Boundaries
Understanding the formula makes it easy to solve any question quickly. These formulas show exactly how to adjust class limits to remove gaps.
🔢 Lower Class Boundary Formula
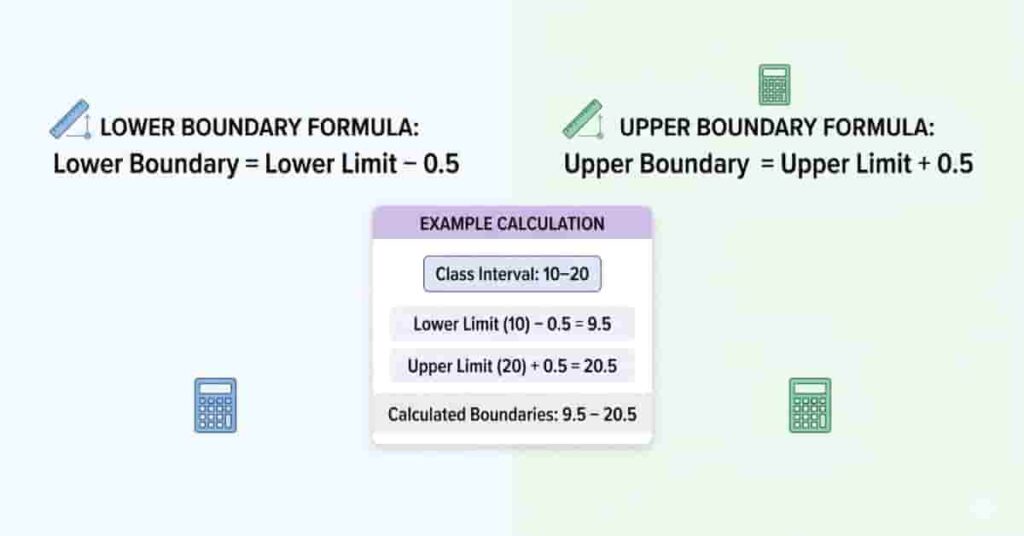
Lower Boundary=Lower Limit−0.5\text{Lower Boundary} = \text{Lower Limit} – 0.5Lower Boundary=Lower Limit−0.5
To calculate the lower class boundary, subtract 0.5 from the lower class limit. This shifts the starting point slightly down.
🔢 Upper Class Boundary Formula
Upper Boundary=Upper Limit+0.5\text{Upper Boundary} = \text{Upper Limit} + 0.5Upper Boundary=Upper Limit+0.5
To determine the upper class boundary, add 0.5 to the upper class limit. This extends the ending point slightly upward.
These simple formulas help convert your grouped data into continuous data. They are widely used in statistics, especially in graphs like histograms.
👉 Quick Tip: Always use the same adjustment value (like 0.5) for all classes to keep your data consistent.
🧮 How to Find Lower and Upper Class Boundaries (Step-by-Step)
Learning how to find the lower class boundary and the upper class boundary is simple. You just need to follow a clear process. These steps work for most grouped data with whole numbers.
✅ Step-by-Step Method
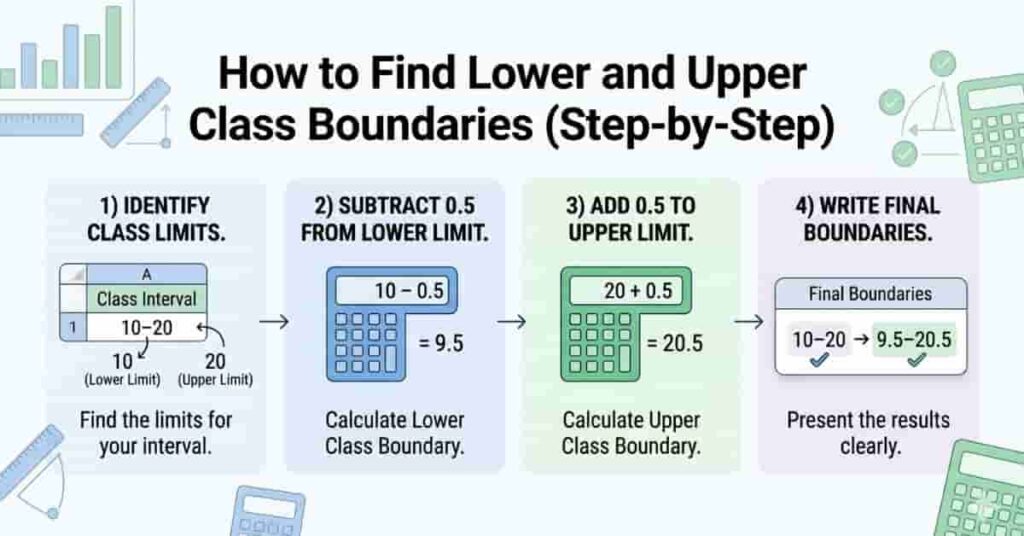
Step 1: Identify class limits
Look at your class interval. For example, 10–20 has a lower limit of 10 and an upper limit of 20.
Step 2: Subtract 0.5 from the lower limit
Take the lower limit and subtract 0.5.
Example: 10 → 9.5 (lower class boundary)
Step 3: Add 0.5 to the upper limit
Now take the upper limit and add 0.5.
Example: 20 → 20.5 (upper class boundary)
Step 4: Write the final boundaries
Combine both values to get the full class boundaries.
Example: 9.5 – 20.5
This method removes gaps between classes, making your data continuous. It is very useful for graphs and exam questions.
👉 Instead of manual steps, you can use a class boundaries calculator to get instant results.
📊 Example of Lower and Upper Class Boundaries
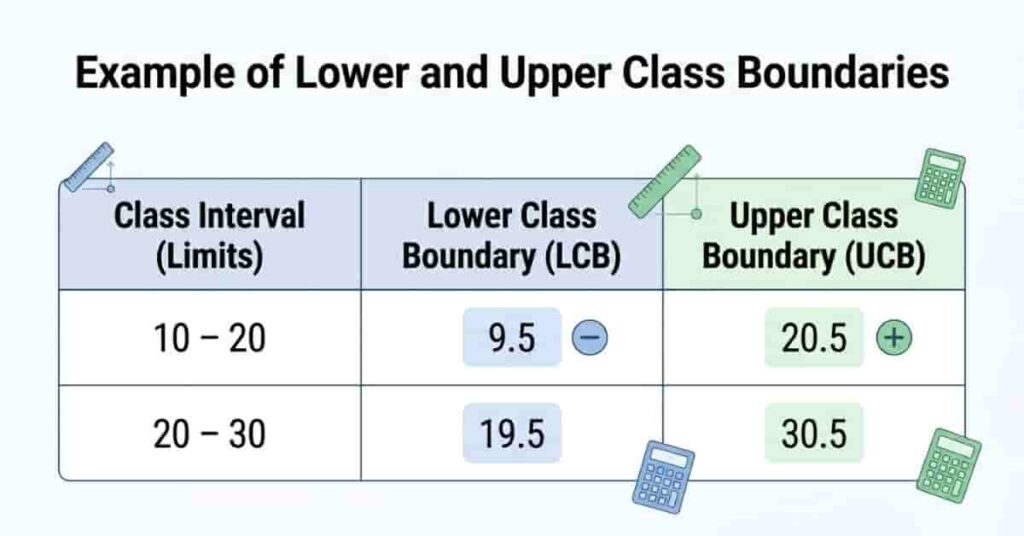
Let’s look at a simple example to understand how class boundaries work. This will help you apply the method quickly in exams and assignments.
| 10 – 20 | 9.5 | 20.5 |
| 20 – 30 | 19.5 | 30.5 |
In each case, we subtract 0.5 from the lower limit and add 0.5 to the upper limit. This removes gaps between classes and makes the data continuous.
For example, the gap between 20 and 20 disappears when we use boundaries 19.5–20.5 and 20.5–30.5. Now, both classes connect smoothly, with no missing values.
“You should also learn how midpoint and class width relate to boundaries for better clarity.”
📈 Why Lower and Upper Boundaries Are Important
Lower and upper class boundaries are more than just small adjustments—they make your data meaningful and accurate. Without them, gaps appear between class intervals, which can confuse beginners and distort statistical graphs.
By defining continuous data, boundaries ensure that every value is assigned to the correct class. For example, without boundaries, a value like 20 might not clearly belong to either 10–20 or 20–30. Boundaries solve this problem by slightly extending or reducing class limits.
Using proper boundaries also improves the accuracy of graphs such as histograms and frequency polygons. Each bar or point now correctly represents all values, giving a clear visual of the data distribution. This is especially important for students, researchers, or anyone analyzing statistics in exams or projects.
In addition, understanding boundaries shows that you grasp the fundamentals of grouped data, boosting your confidence and credibility when presenting results.
⚠️ Common Mistakes Students Make
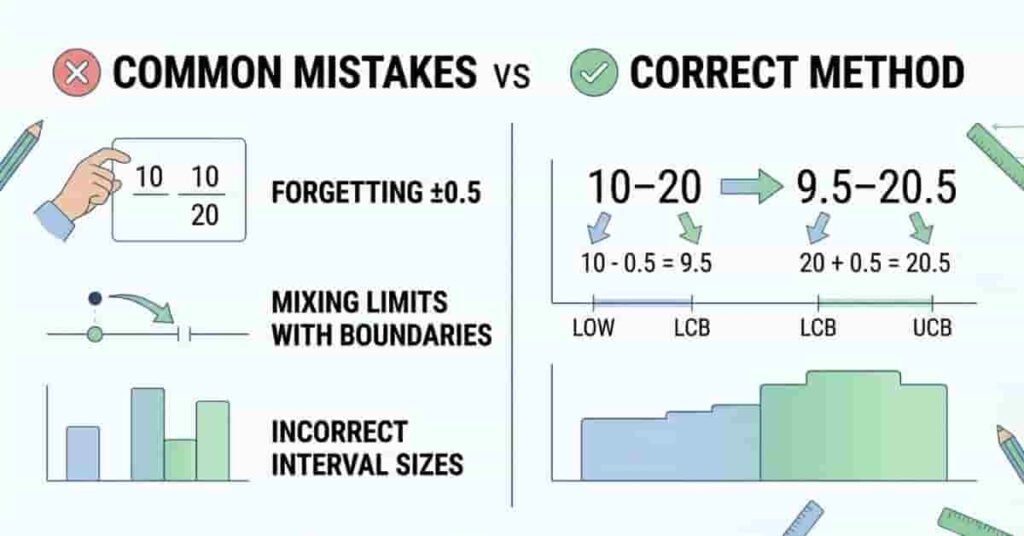
Many beginners struggle with lower and upper class boundaries, often making simple mistakes that lead to errors in graphs and calculations. Knowing these pitfalls can save time and improve accuracy.
❌ Forgetting ±0.5 Adjustment
A common error is skipping the small adjustment. Without subtracting 0.5 from the lower limit or adding 0.5 to the upper limit, gaps remain between classes, and graphs look incorrect.
❌ Mixing Limits with Boundaries
Some students confuse class limits with boundaries. Remember: limits are the original values, while boundaries slightly adjust them to include all values. Using limits directly in graphs causes misrepresentation.
❌ Using Incorrect Interval Size
Incorrect class interval sizes can lead to wrong boundaries. Always check the range of each class before applying the ±0.5 adjustment. Consistent intervals ensure accurate and continuous data.
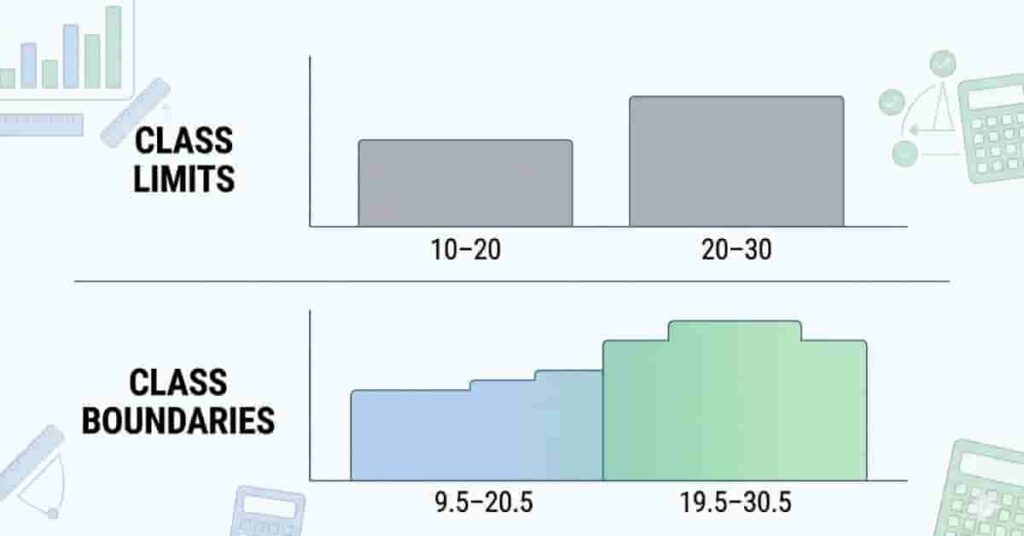
🔗 Difference Between Class Limits and Class Boundaries
Understanding the difference between class limits and class boundaries is essential for accurate data analysis. Many beginners mix these terms, which can lead to mistakes in graphs and calculations.
- Class Limits: These are the original starting and ending values of a class. For example, in 10–20, 10 is the lower limit, and 20 is the upper limit.
- Class Boundaries: These are adjusted slightly to remove gaps. Using the same class, the boundaries become 9.5–20.5.
✅ Key Difference: Limits define the class range, while boundaries create continuous data by extending or reducing limits slightly.
For more practice and automatic calculation, try our Class Boundaries Calculator.
🧠 Related Concepts You Should Learn
To fully understand class boundaries, it’s helpful to explore related topics:
- How to Find Class Boundaries – Step-by-step guide with examples
- Class Width and Midpoint – Learn how to calculate intervals and midpoints
- Frequency Distribution – Organize and visualize grouped data effectively.
These concepts connect naturally and will strengthen your understanding of statistics.
Conclusion
In this article, we explained lower and upper class boundaries and how they create continuous, accurate data. You learned how to calculate boundaries step by step, understood common mistakes, and saw clear examples for easy application.
Using class boundaries ensures your graphs, frequency distributions, and statistical calculations are precise. Beginners in the USA can now confidently handle grouped data and avoid gaps between classes. Concepts like lower class boundary, upper class boundary, and class limits are simpler when you follow the methods outlined here.
👉 Try applying these techniques in your assignments or practice questions. Don’t forget to use our Class Boundaries Calculator for instant results. Share your experience or questions in the comments to help others learn too!
Team ClassRank builds smart, student-friendly calculators to make grade and rank tracking simple and accurate. For questions or feedback, contact us at classrankcalculator@gmail.com.