Introduction
Stuck finding a class interval’s midpoint?
If you’re learning statistics in the USA, this comes up a lot. Students use class midpoints in assignments, quizzes, and basic data analysis. It also appears when working with grouped data or building simple charts. Many beginners find it confusing at first, especially without a quick method.
A class midpoint calculator can simplify the process by instantly providing accurate midpoints. It eliminates guesswork, reduces the chances of calculation errors, and offers a fast way to validate manual results. This makes solving problems quicker and more reliable.
In this guide, you’ll learn what a class midpoint is and why it matters. You’ll also see how to calculate it step by step using a simple formula. By the end, you’ll feel confident solving midpoint problems on your own.
Try our Class Midpoints in Frequency Distributions tool now to make multi-interval calculations easy.
What is a Class Midpoint?
A class midpoint is the center value of a class interval in statistics. Representing a group of data with a single number offers simplicity and clarity. When working with grouped data, tables, or charts, students find the midpoint especially useful.
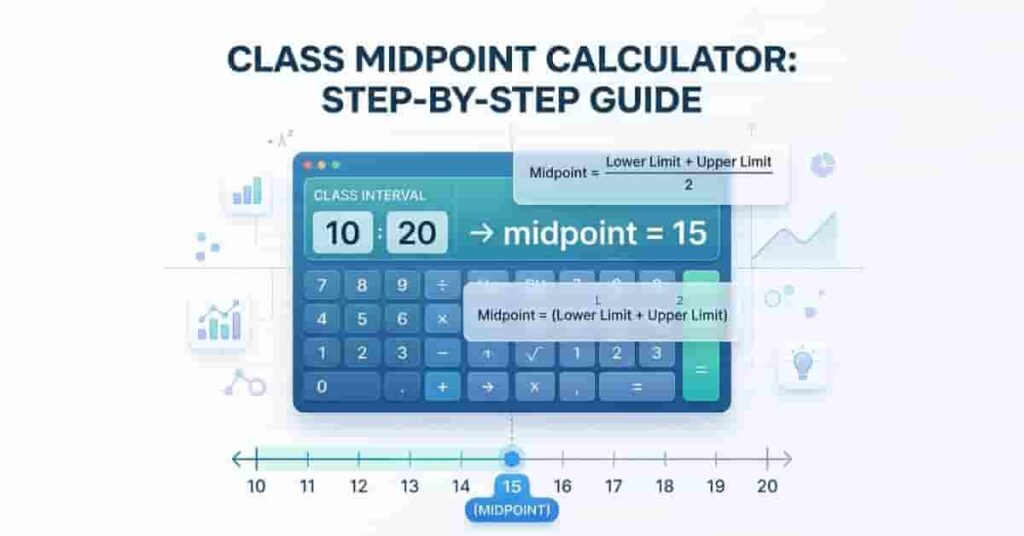
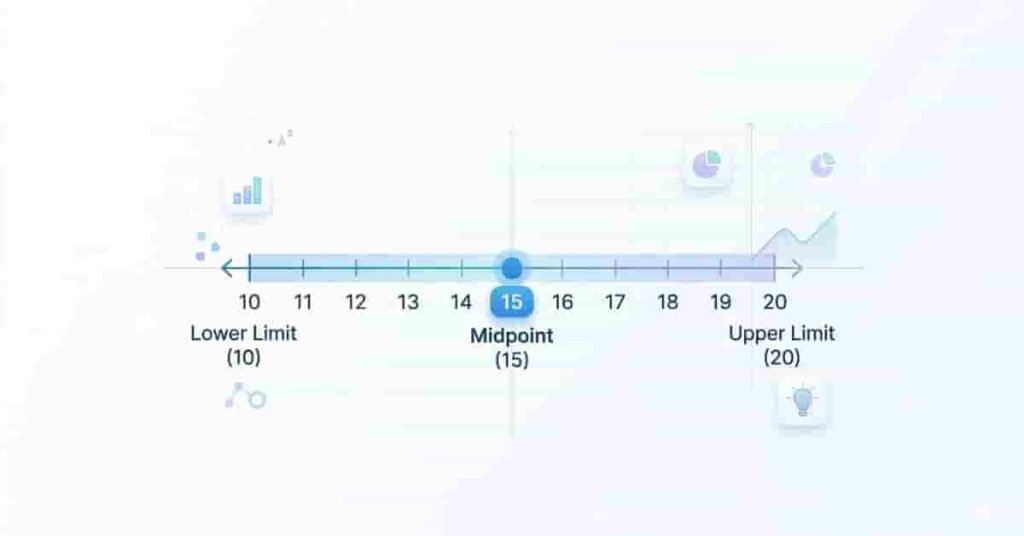
The midpoint, calculated by averaging a class interval’s lower and upper limits, sits precisely in the center of the range. Take the interval 10–20, for example. Here, the midpoint is 15, which offers a quick summary of the entire group.
This method is widely used in textbooks and classroom exercises to simplify large datasets. You often see it when finding means or creating histograms.
Think of it as a shortcut. It lets you use a single value for the whole class, saving time and reducing exam errors.
Takeaways
- A class midpoint is the center of a class interval.
- It is found by averaging the lower and upper limits.
- It simplifies grouped data calculations.
- It is commonly used in school statistics problems.
Midpoint Formula Explained
To find a class midpoint, you only need a simple formula. This method works for any class interval and is easy to remember.
This class midpoint formula helps you find the center of any interval in seconds. It is widely used in basic statistics and in calculations involving grouped data.
Let’s break down each part:
- Lower Limit: The smallest number in the class interval
- Upper Limit: The largest number in the class interval
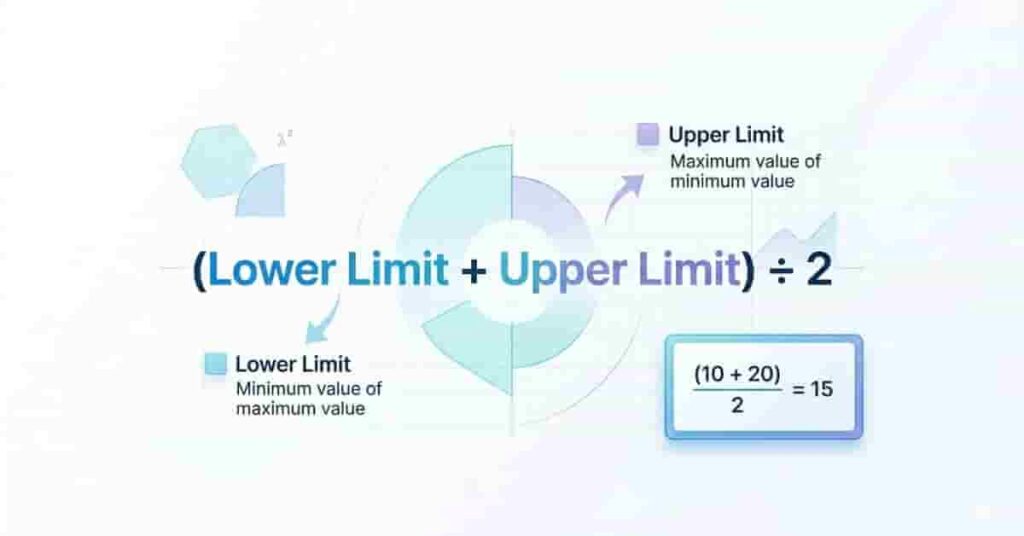
Now, apply the formula to a simple example.
For the interval 10–20, add both limits: 10 + 20 = 30. Then divide by 2.
The midpoint is 15.
This process is also called the midpoint of the interval method. It works the same way for all ranges, no matter the numbers. Students often use it when solving problems in frequency tables or finding averages.
With practice, you can calculate class midpoints quickly without mistakes. You can also use a class midpoint calculator to check your answers.
Pro Tips
- Always double-check your addition before dividing.
- Keep your answers neat to avoid exam errors.
- Use a calculator to verify tricky numbers.
Step-by-Step Example for Students
Let’s learn how to calculate a class midpoint using a simple example. This method works the same for all class intervals, so once you understand it, you can solve any question.
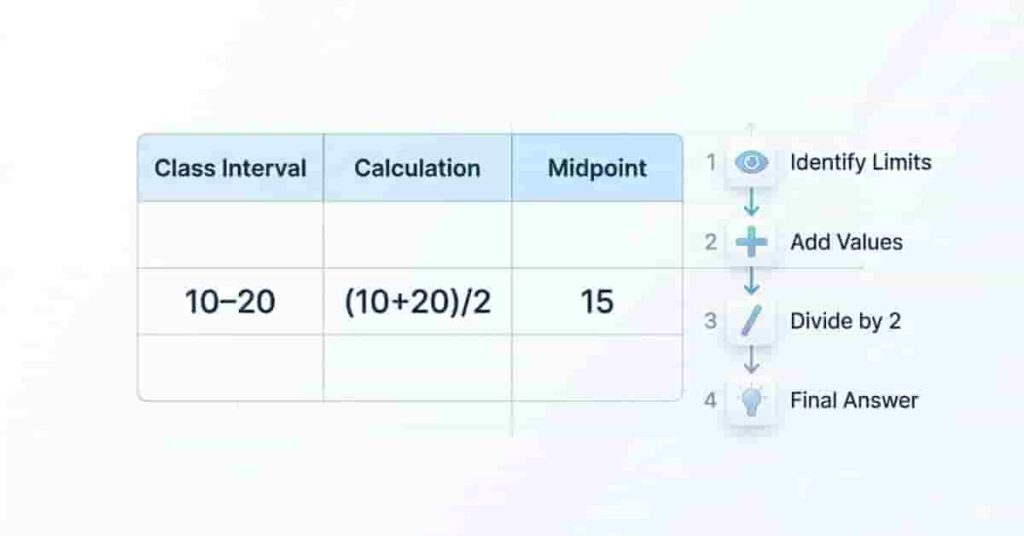
Example Table
| 10 – 20 | (10 + 20) / 2 | 15 |
In this example, we take the lower and upper limits and apply the midpoint formula. The result gives us the center value of the interval.
Follow These Steps
- Identify the limits → Lower limit = 10, Upper limit = 20
- Add the values → 10 + 20 = 30
- Divide by 2 → 30 ÷ 2 = 15
- Final answer → Midpoint = 15
This step-by-step midpoint calculation is very useful in exams. It helps you stay organized and avoid mistakes. You can apply the same process to any interval, even larger numbers.
If you want to save time, try using an interactive class midpoint calculator. It gives instant results and helps you verify your answers.
Pro Tips
- Write each step clearly during exams.
- Don’t skip dividing by 2 (common mistake)
- Practice with grouped data for better understanding
Quick Tips & Common Mistakes
Understanding when and how to use class midpoints can save you time in exams and assignments. Many students lose marks due to small mistakes, not because the concept is hard.
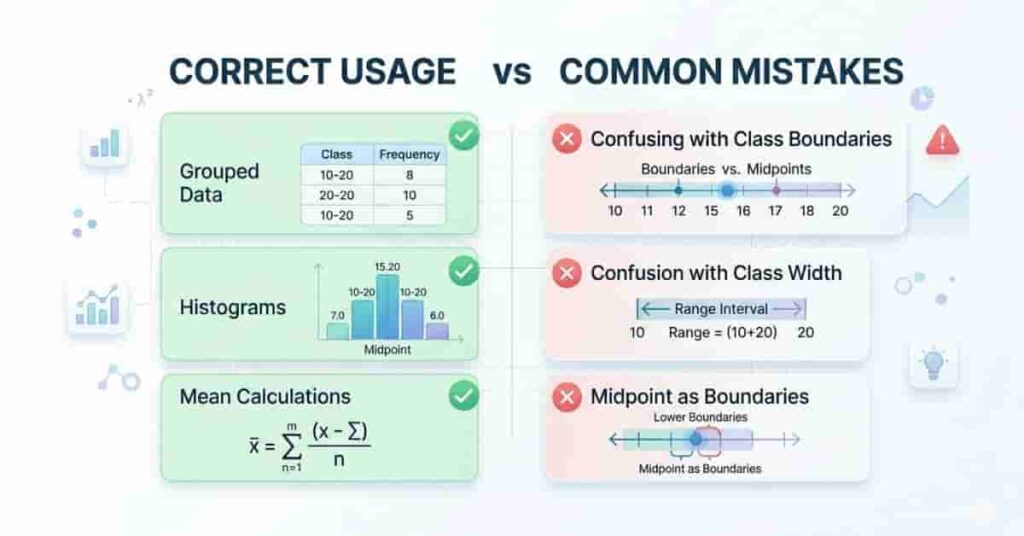
You should use class midpoints in these cases:
- Grouped data → when values are arranged in intervals
- Histograms → to represent data visually
- Mean calculations → to find averages from frequency tables
Midpoints are a simple way to represent each class interval with a single value. This makes large datasets easier to handle and analyze.
However, beginners often confuse midpoints with other terms. A common mistake is mixing them with class boundaries or class width. The midpoint is the center value, while boundaries define limits, and the width shows the size of the interval.
Another mistake is skipping steps or making calculation errors. Always add carefully and divide correctly. Even small errors can lead to wrong answers.
To ensure accuracy, verify your results using a calculator or tools such as Excel. This helps you catch mistakes quickly and build confidence.
Takeaways
- Use midpoints for grouped data and charts.
- Don’t confuse midpoint with boundaries or width.
- Always follow the correct formula steps.
- Double-check answers using a calculator.
Visuals / Interactive Elements
Visual aids can make class midpoint concepts much easier to understand. Instead of reading only text, you can see how the formula works step by step. This is especially helpful for beginners who learn better with examples.
Simple Table Example
| 10 – 20 | (10 + 20) / 2 | 15 |
This table shows how a single interval turns into a midpoint. It helps you quickly understand the process without confusion.
Formula Highlight Box
Always remember the core idea:
Add the lower and upper limits, then divide by 2.
You can highlight this formula in your notes to revise quickly during exams.
Try It Yourself
Use the interactive calculator above to test different values. Change the numbers and see how the midpoint updates instantly. This helps you learn faster and avoid mistakes.
conclusion
You’ve learned what a class midpoint is, why it matters, and how to calculate it step by step. You also saw how a class midpoint calculator can save time and reduce mistakes in exams and assignments. With these basics, you can now handle simple interval problems with confidence.
Ready to go further? Learn how to work with multiple intervals and grouped data. Explore Class Midpoints in Frequency Distributions for detailed, step-by-step examples.
If this guide helped you, share it with classmates or bookmark it for revision. You can also try more practice problems on our site to improve your skills faster.
Team ClassRank builds smart, student-friendly calculators to make grade and rank tracking simple and accurate. For questions or feedback, contact us at classrankcalculator@gmail.com.