Introduction
Are you a U.S. student struggling to find an average with grouped data? Many beginners use a class midpoint calculator when raw data isn’t available. This tool simplifies statistics for those just starting with grouped data.
In this guide, you will learn how to find midpoints step by step and use them to calculate averages easily. We will also explain frequency distributions, the calculation of grouped data midpoints, and common mistakes students make. If you are new to midpoints, see Class Midpoint Basics for single-interval examples before moving to multiple intervals. This topic is important for exams, homework, and for real-world data interpretation.
By the end, you will feel confident solving grouped data problems without confusion. Teachers in the USA often introduce midpoints early in statistics courses. Understanding them lays a strong foundation for later algebra and data analysis.
Understanding Frequency Distributions & Midpoints
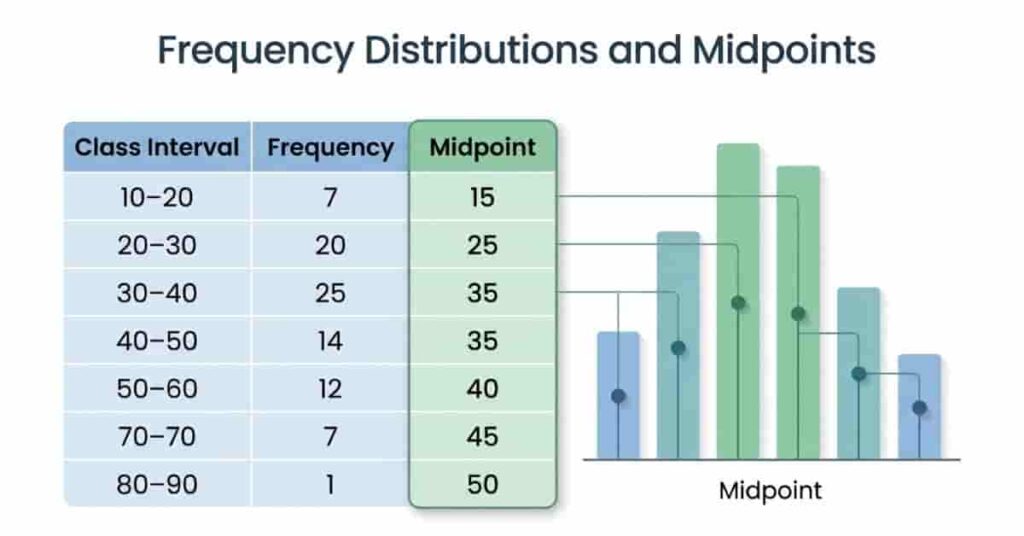
A frequency distribution is a way to organize data into class intervals and show how often each interval appears. Instead of listing every value, data is grouped into ranges such as 10–20 or 20–30. This makes large datasets easier for students in the USA to read and analyze.
In grouped data, we cannot use exact values for calculations. That is why we use midpoints. A midpoint is the center value of each class interval. For example, the midpoint of 10–20 is 15. This approach helps when working with grouped data, midpoint calculation, and frequency distribution statistics, especially when raw data is missing or too large.
Midpoints are widely used in exam questions, homework, and classroom projects. They help students estimate averages and quickly understand data patterns. Many teachers also use them to introduce the mean using midpoint concepts in a simple way. Learning this skill builds confidence in handling real statistical problems step by step.
Step-by-Step Guide for Multiple Intervals
When working with grouped data, the process becomes easier if you follow a clear, step-by-step method. A class frequency midpoint calculator follows the same logic by breaking data into intervals and solving it systematically. This method is commonly used in frequency distribution statistics for exams and assignments in the USA.
Example Table
| 10 – 20 | 5 | 15 | 75 |
| 20 – 30 | 7 | 25 | 175 |
| 30 – 40 | 8 | 35 | 280 |
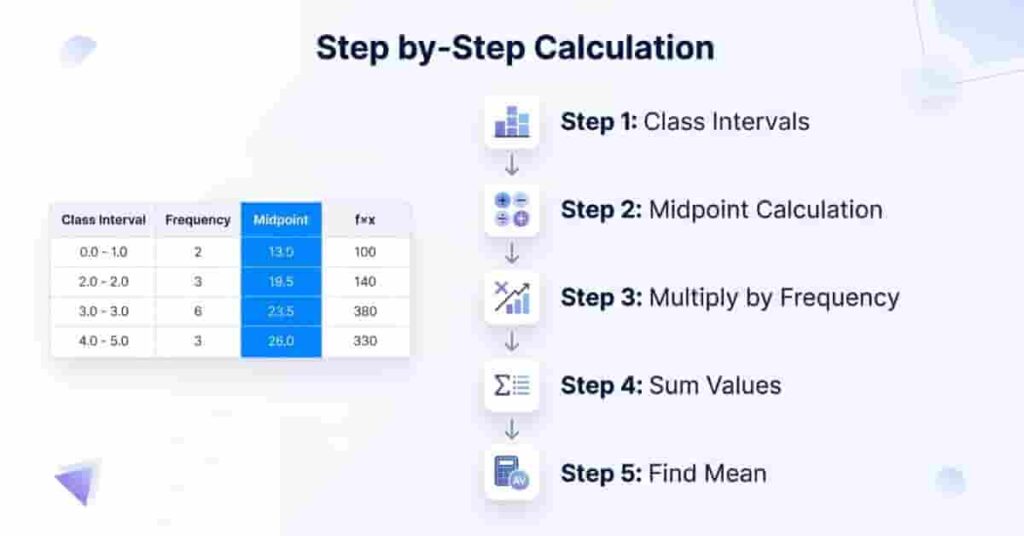
Step-by-Step Process
- First, identify all class intervals in your dataset. These ranges clearly organize your grouped data.
- Next, calculate the midpoint of each interval by averaging the lower and upper limits.
- Then, multiply each frequency by its midpoint to find the weighted values for the mean calculation.
- After that, add all f × x values together and divide by the total frequency to get the final mean.
- You can also add optional columns, such as cumulative or relative frequency, for deeper analysis.
In most grouped data midpoint calculation problems, the midpoint column plays the most important role. It helps simplify large datasets into manageable values, making statistical analysis faster and more accurate for students.
Calculating Mean Using Midpoints
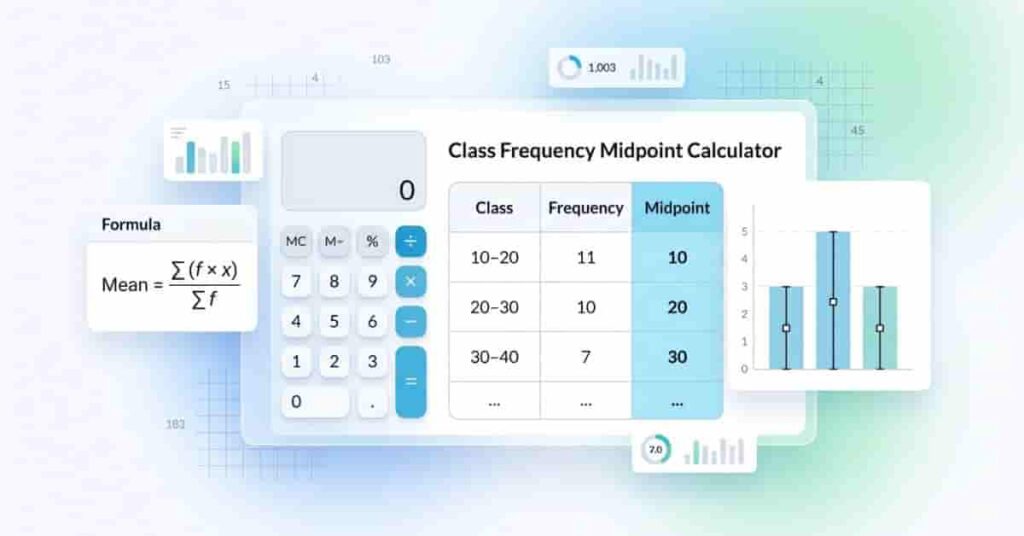
The mean of grouped data helps you find the average when you only have class intervals instead of exact values. A class frequency midpoint calculator uses midpoints to estimate the mean in a simple, structured way. This method is widely used in frequency distribution statistics because it works well for large datasets.
Formula
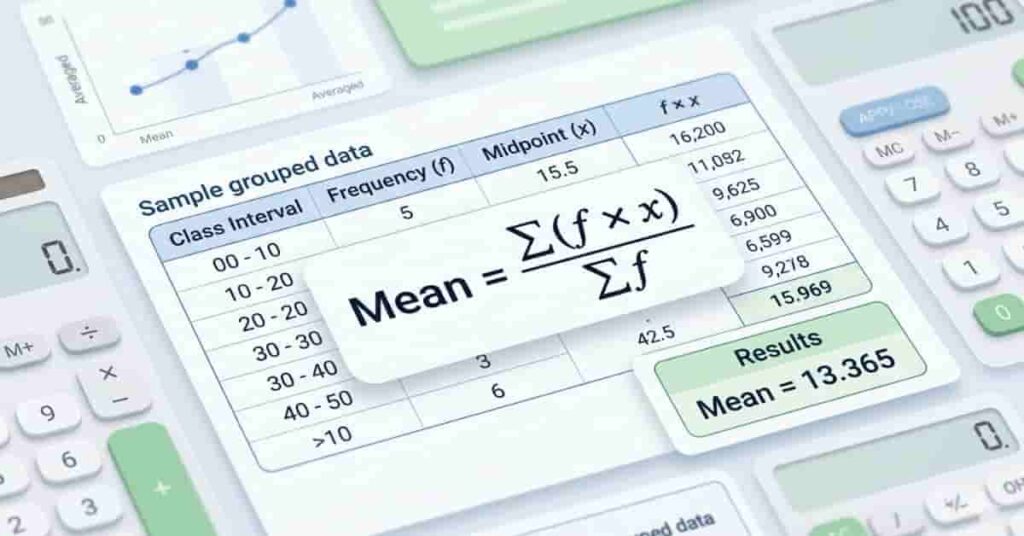
FORMULA
Mean = (Σ f × x) / Σ f
Here, f is the frequency of each class, and x is the midpoint of that class. The symbol Σ means “sum of all values.”
Step-by-Step Example
Let’s use the table from the previous section.
- First, add all frequency values:
5 + 7 + 8 = 20 - Next, add all f × x values:
75 + 175 + 280 = 530 - Now apply the formula:
Mean = 530 ÷ 20 = 26.5
So, the estimated mean of the grouped data is 26.5.
This method shows how midpoints simplify complex data into one easy average. Instead of using every raw value, we rely on class centers to quickly estimate results. That is why calculating grouped-data midpoints is a key skill in statistics classes across the USA.
This approach also connects directly with homework problems and exam questions. Teachers often test students’ understanding of the mean using midpoints because it assesses both logical and computational skills.
Takeaway
The midpoint method turns large grouped datasets into a simple average. Once you understand the formula, solving these problems becomes fast and reliable, even in timed exams.
Visual Learning & Interactive Tools
Visual learning makes statistics much easier, especially when students work with grouped data and midpoints. A class frequency midpoint calculator becomes even more effective when combined with clear visuals and step-by-step diagrams. These tools help students in the USA understand how raw intervals turn into final averages.
One of the best visuals is a frequency distribution table with highlighted midpoint values. This helps learners quickly identify the center of each class interval without confusion. It also supports grouped data midpoint calculation by showing each step clearly in one place.
Another helpful visual is a flow diagram that explains the full process. You can show it as a simple chain like this: Interval → Midpoint → Multiply by Frequency → Sum → Mean. This makes the logic easy to follow, even for beginners who struggle with frequency distribution statistics.
You can also add an interactive practice calculator for students. This allows them to enter class intervals and frequencies to test their understanding. It improves engagement and reinforces the concept of the mean using midpoints in a practical way.
Pro Tips
- Always color-highlight the midpoint column to avoid mistakes in calculations.
- Use flowcharts when revising before exams to strengthen memory.
- Practice interactive examples to improve speed at solving grouped-data problems.
Conclusion
In this guide, we explored how to calculate midpoints in frequency distributions step by step. You learned how class intervals work, how to find midpoints, and how to use them to calculate the mean easily. We also looked at tables, formulas, and common mistakes students should avoid.
A class frequency midpoint calculator speeds up and improves the accuracy of this process, especially for beginners in the USA. It helps simplify grouped data and improves understanding of frequency distribution statistics and mean using midpoints.
Now it’s your turn to practice with real examples and strengthen your skills in statistics.
If you found this guide helpful, share it with your classmates or leave any questions in the comments. You can also explore more lessons on midpoints, boundaries, and advanced grouped data techniques on our site.
Team ClassRank builds smart, student-friendly calculators to make grade and rank tracking simple and accurate. For questions or feedback, contact us at classrankcalculator@gmail.com.