
Table of Contents
Introduction
When working with grouped data, students often struggle to connect midpoints to class intervals. Midpoints show each class’s center value, making statistical data easier to interpret and helping estimate averages and create frequency distributions.
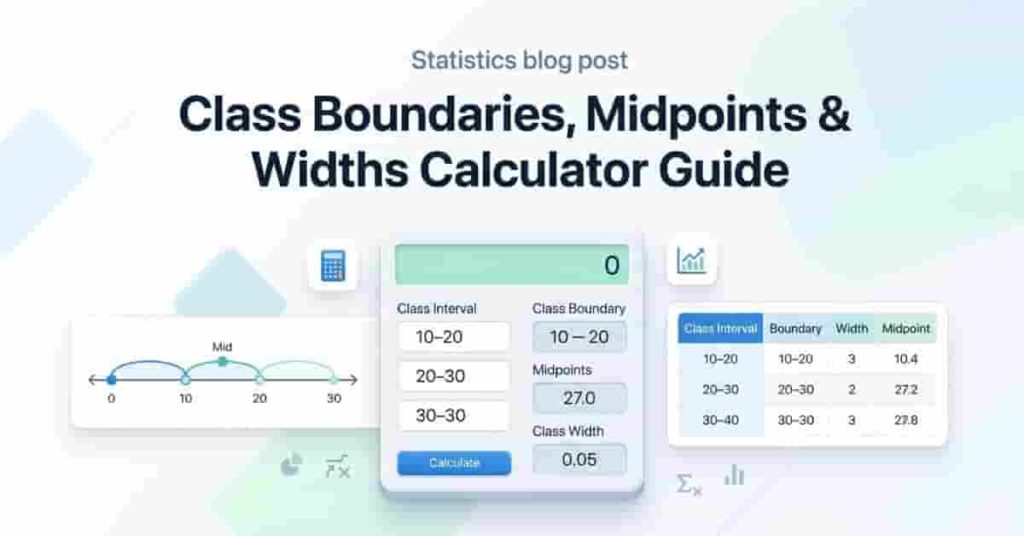
As data becomes more complex, you also need to understand class boundaries and class widths. Class boundaries remove gaps between intervals, while class width shows the size of each class. Together, these concepts create a clear structure for analyzing data accurately. The class boundaries, midpoints, and widths calculator speeds up and improves the reliability of these steps for students.
These concepts are important because they directly support histograms, frequency polygons, and accurate mean calculations. Without understanding midpoints, class boundaries, and class widths, grouped data can lead to incorrect interpretations. If you’re still learning about midpoints for single or multiple intervals, see Class Midpoint Basics and Class Midpoints in Frequency Distributions for more details.
Instead of doing manual calculations every time, you can use the calculator below. It instantly finds midpoints, class boundaries, and widths. It helps you learn faster while avoiding calculation mistakes.
What Are Class Boundaries and Widths?
Class boundaries and class widths are essential for organising grouped data and removing confusion when working with intervals. These concepts are used in histograms, frequency tables, and statistical analysis.
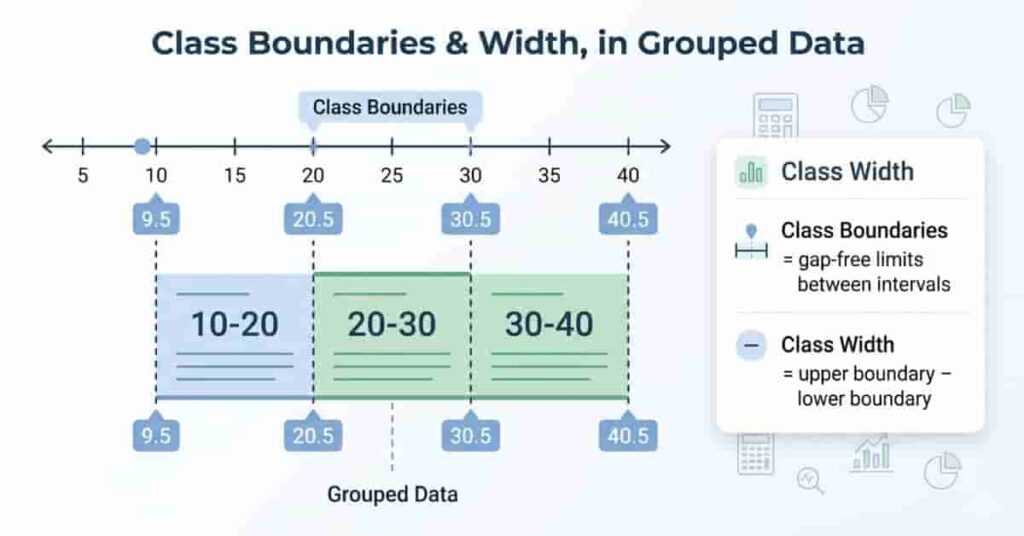
Class boundaries are values that separate class intervals without gaps, ensuring a smooth transition of data between groups. For instance, if one class ends at 20 and the next starts at 21, a gap exists; adjusting boundaries connects the intervals. This method provides accurate graphs when calculating boundaries in grouped data statistics.
Class width is the size of each class interval. It shows how wide each group is in your dataset. You can find it by subtracting the lower boundary from the upper boundary. This is often called the class interval width formula in statistics. Keeping class width consistent is important because uneven widths can distort histograms and frequency polygons.
For example,
for the class interval 10–20, remove the gaps by adjusting the limits: the lower boundary is 9.5, and the upper boundary is 20.5. The width is 20.5 − 9.5 = 11, so the class width is 11, not 10.
Understanding these values helps you avoid mistakes in grouped data calculations. It also makes charts more accurate and easier to read, especially when dealing with large datasets in school or college statistics.
Step-by-Step: Calculating Boundaries, Widths, and Midpoints
Grouped data is easier to understand when presented step by step. Follow these steps to correctly find class boundaries, class widths, and midpoints. This process is used in histograms, frequency polygons, and statistical analysis.
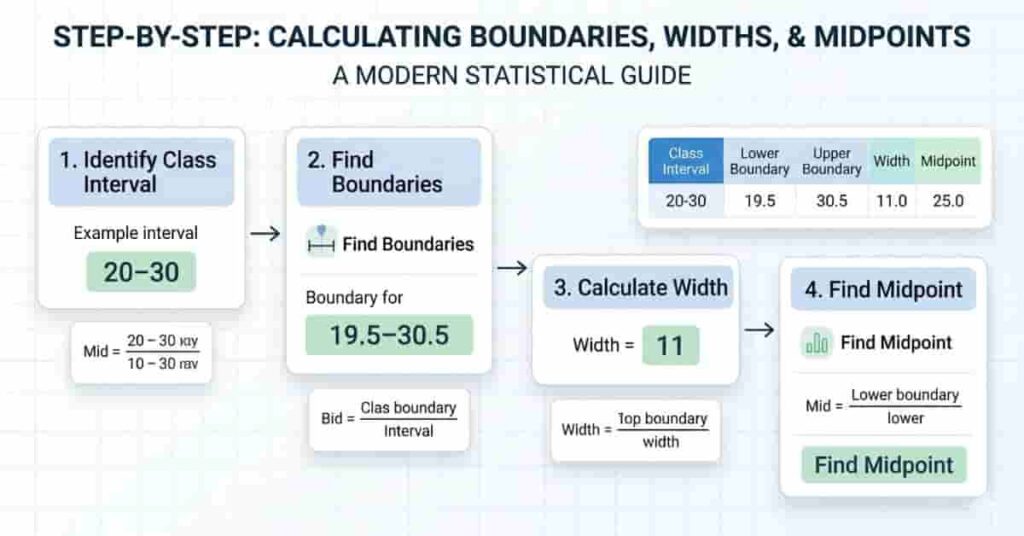
First, identify the class interval, such as 10–20 or 20–30. Make sure your intervals are continuous and in order before continuing.
Next, determine the lower and upper class boundaries. These boundaries remove gaps between intervals and make the data continuous. This step is important when working with grouped data boundaries in statistics because even a small mistake can affect your final graph or calculation.
After that, calculate the class width. Use the class interval width formula by subtracting the lower boundary from the upper boundary. This tells you how wide each class is and ensures consistency across your dataset.
Finally, calculate the midpoint using the formula (Lower limit + Upper limit) ÷ 2. The midpoint represents the centre value of each class and is widely used in estimating averages and frequency distributions.
Worked Example Table
| 10 – 20 | 9.5 | 20.5 | 11 | 15 |
| 20 – 30 | 19.5 | 30.5 | 11 | 25 |
| 30 – 40 | 29.5 | 40.5 | 11 | 35 |
In this table, you can clearly see how boundaries, widths, and midpoints stay consistent across all intervals. The highlighted columns show how each value connects to form a complete grouped data structure. This makes it easier to interpret large datasets and build accurate statistical graphs.
Visualization
Visual representation makes grouped data much easier to understand. A number line helps you clearly see how class intervals connect. It also shows midpoints exactly in the centre of each interval, making it easy to understand the data distribution at a glance.
A histogram is another powerful way to visualise class boundaries, widths, and midpoints. Each bar represents a class interval, while the height shows frequency. Proper labelling of class boundaries ensures there are no gaps between bars, thereby creating an accurate, continuous graph. Midpoints can also be marked to better understand the centre of each group.
Practical Example
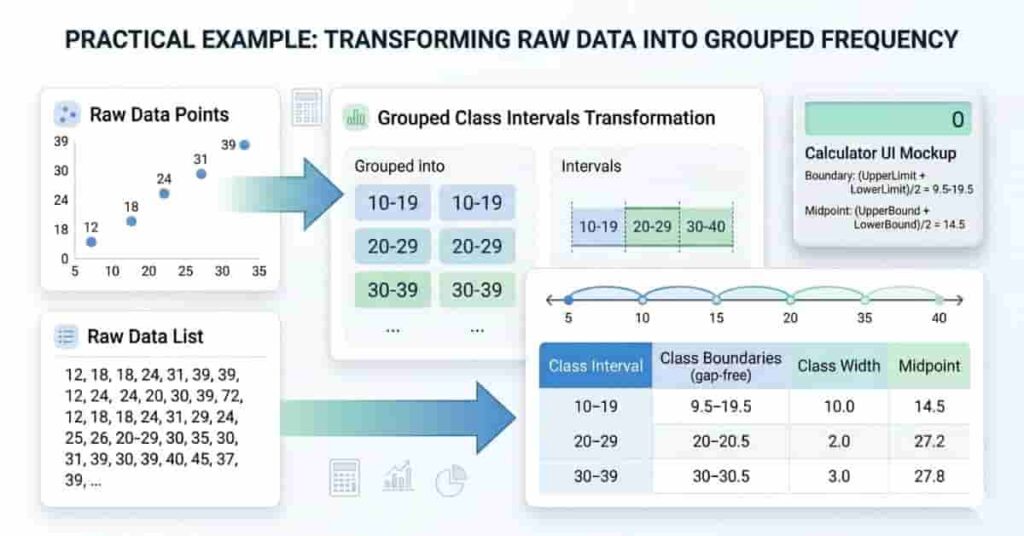
Let’s understand class boundaries, midpoints, and width using a simple dataset. This helps you see how raw data is converted into structured, grouped data for statistical analysis.
Suppose we have the following raw scores: 12, 15, 18, 22, 25, 28, 32, 35, 38. First, we group the data into class intervals to make interpretation easier. This is the foundation of grouped data used in histograms and frequency tables.
Next, we convert these into class intervals and calculate boundaries, midpoints, and widths step by step. The process becomes more accurate when you apply consistent rules for each interval.
Step-by-Step Table
| 10 – 20 | 9.5 | 20.5 | 11 | 15 |
| 20 – 30 | 19.5 | 30.5 | 11 | 25 |
| 30 – 40 | 29.5 | 40.5 | 11 | 35 |
This table shows how raw data becomes structured, grouped data. You can clearly see how boundaries remove gaps, widths stay consistent, and midpoints represent the centre of each class.
For practice, you can quickly verify your calculations using the built-in calculator above. It helps you test different values and improves your understanding of grouped data faster.
Quick Tips & Student Advice
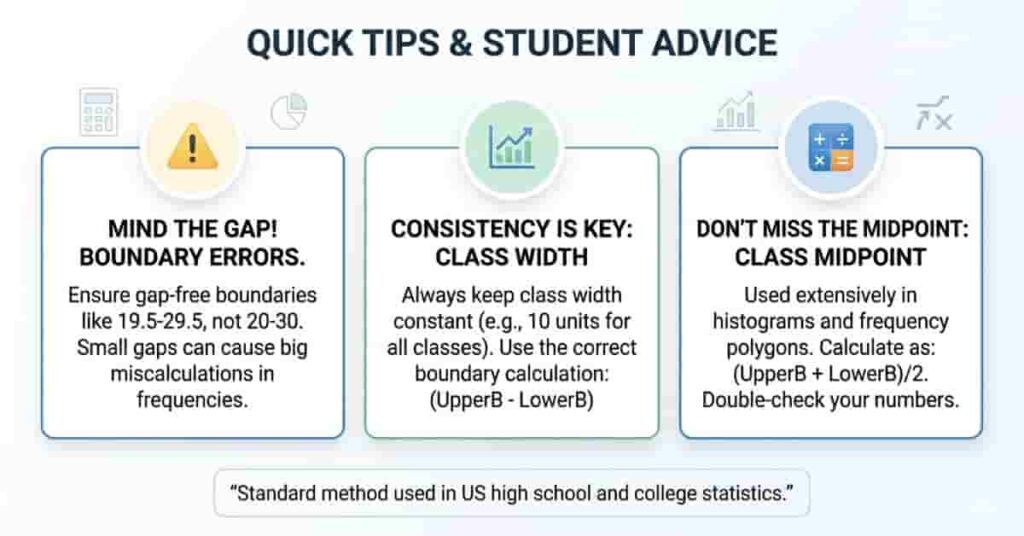
Working with class boundaries, midpoints, and class widths becomes much easier when you follow a few simple habits. These small checks help you avoid common mistakes in grouped data and improve accuracy in graphs and calculations.
Always double-check your class boundaries, especially when decimals are involved. A small error in boundary values can shift your entire histogram or frequency table. This is one of the most common mistakes students make when learning grouped data boundaries in statistics.
Make sure your class width stays consistent across all intervals. Uneven widths can distort histograms and give misleading results. A consistent class interval width formula helps keep your data structured and easy to interpret.
Remember that midpoints play a major role in finding averages and drawing frequency polygons. If your midpoints are incorrect, your final mean calculation will also be wrong. That’s why accuracy in midpoint calculation is essential for all grouped data problems.
These methods are standard in US high school and college statistics courses. Once you understand them, you can confidently handle histograms, grouped data tables, and frequency distributions without confusion.
conclusion
This article explained how class boundaries, midpoints, and class widths work in grouped data. You also learned step-by-step calculations with examples and a simple practical table.
Understanding the class boundaries, midpoints, and widths calculator helps students solve grouped-data problems faster and more accurately. It also supports concepts such as class width and midpoint calculators and grouped data boundaries in statistics.
Mastering these ideas improves accuracy in histograms, frequency polygons, and mean calculations.
Want faster results? Use digital tools and Excel templates to practice and check your answers instantly.
Share this guide with classmates or explore more statistics resources on our website.
Team ClassRank builds smart, student-friendly calculators to make grade and rank tracking simple and accurate. For questions or feedback, contact us at classrankcalculator@gmail.com.