

Table of Contents
Introduction
Have you ever wondered how statisticians quickly track totals across a dataset without repeating calculations?
If you’re learning how to calculate cumulative frequency, you’re in the right place. Cumulative frequency is a simple statistical method that shows the running total of frequencies. It helps you understand how data builds over time and makes large datasets easier to analyze. Beginners across the USA often use it for school assignments, research projects, surveys, business reports, and quality control.
In this guide, you’ll learn how to calculate cumulative frequency step by step with easy examples, simple formulas, and clear tables. You’ll also discover how to calculate cumulative frequency in statistics and avoid common mistakes that can lead to incorrect results. If you want a faster solution, you can use our Cumulative Frequency Calculator to generate accurate cumulative frequencies instantly. Whether you’re a student, teacher, or professional, this guide will help you calculate cumulative frequency with confidence.
What Is Cumulative Frequency?
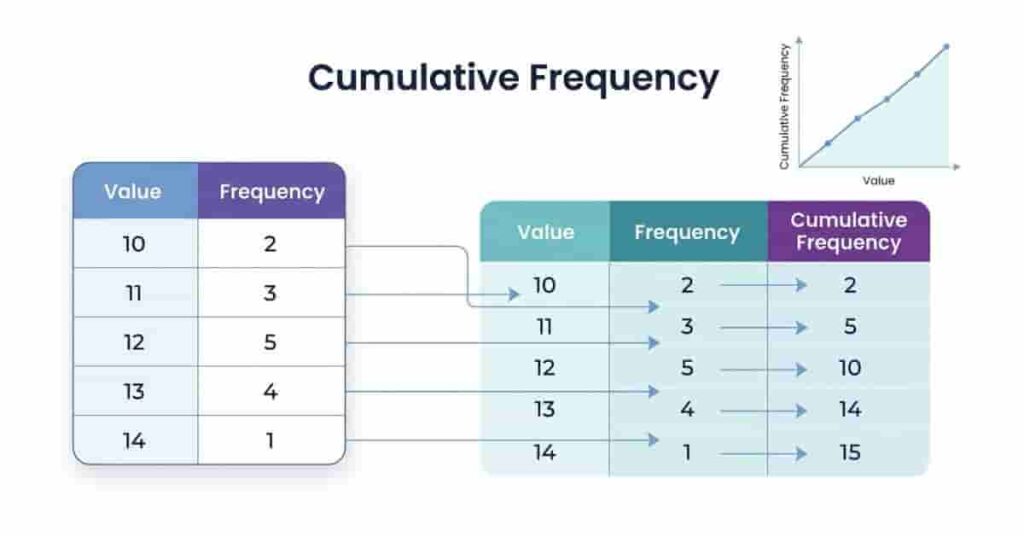
Cumulative frequency is the running total of frequencies in a dataset. Instead of looking at each value separately, it shows how many observations have been counted up to a certain point. This makes it easier to understand how data is distributed and compare results across different groups.
If you’re learning how to calculate cumulative frequency, it’s important to understand the concept before applying the formula. Once you know how cumulative frequency works, calculating it becomes a simple process of adding frequencies one by one. This method is widely used in statistics, education, research, business, and quality control because it helps summarize large amounts of data clearly.
Whether you’re working with individual values or grouped data, cumulative frequency helps you identify patterns, create graphs, and interpret results more confidently.
Before calculating running totals, it helps to understand how a cumulative frequency table organizes frequencies across different values or class intervals.
Takeaways
- Cumulative frequency is a running total of frequencies.
- It helps organize and interpret data more easily.
- It is useful for both simple and grouped datasets.
- Understanding this concept makes cumulative frequency calculation much easier.
Definition
Cumulative frequency is the total number of observations up to and including a specific value or class interval. You calculate it by adding each frequency to the cumulative total before it. The first cumulative frequency is always equal to the first frequency because there are no previous values to add.
For example, suppose five students scored 60 marks and three students scored 70 marks. The cumulative frequency for 70 marks is 8 because you add 5 and 3 together. You continue this process until you reach the final value in the dataset.
Expert Tip: Before you calculate cumulative frequency, sort your data in ascending order. This simple step helps prevent mistakes and ensures accurate running totals.
Why Cumulative Frequency Is Important
Cumulative frequency helps you understand how data builds over time instead of viewing each value in isolation. It makes large datasets easier to read and highlights patterns that might not be obvious from a standard frequency table.
In statistics, cumulative frequency is often used to calculate percentiles, quartiles, and medians. It also supports graphs such as ogives, which help visualize how observations accumulate across a dataset. Students use it in classroom assignments, while researchers and analysts rely on it to summarize survey and experimental data.
Knowing how to calculate cumulative frequency in statistics also improves your ability to compare datasets and make informed decisions based on trends rather than individual values.
Pro Tip: Always check that the final cumulative frequency equals the total number of observations. If it doesn’t, review your calculations for errors.
When Should You Use It?
You should use cumulative frequency whenever you need to see the running total of observations rather than individual counts. It is especially helpful when working with ordered data or grouped frequency tables.
Common situations include:
- Solving statistics homework and exam questions.
- Analyzing survey responses.
- Preparing research reports.
- Tracking business performance over time.
- Monitoring product quality in manufacturing.
- Summarizing large datasets for easier analysis.
For beginners, cumulative frequency provides a clear picture of how data accumulates. It also serves as the foundation for advanced statistical concepts such as cumulative frequency graphs, percentiles, and grouped data analysis.
Understanding a Frequency Table
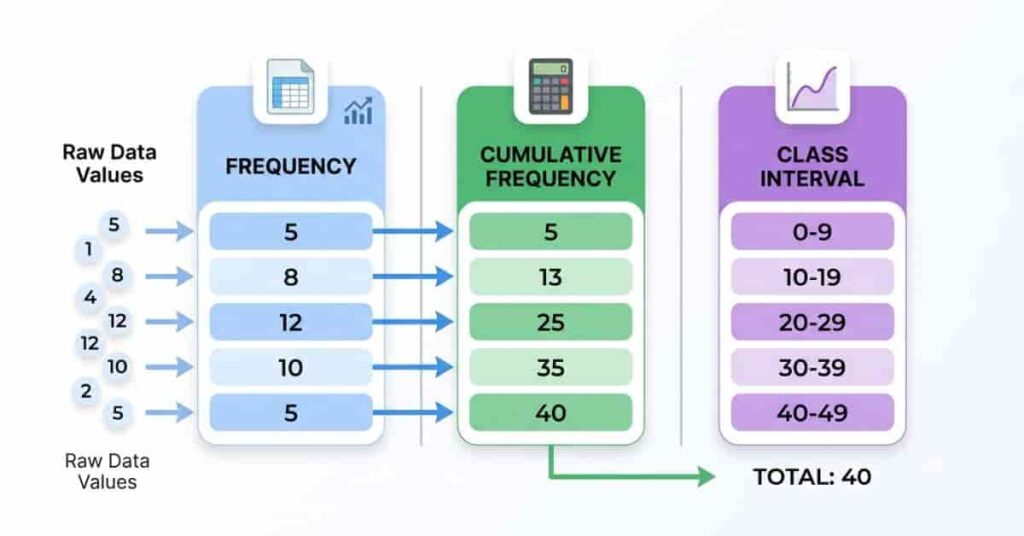
Before you learn how to calculate cumulative frequency, you need to understand a frequency table. A frequency table organizes data into a simple format, making it easier to count, compare, and analyze values. Instead of reviewing every observation one by one, you can quickly see how often each value or group appears.
When your data is divided into class intervals, you can follow our guide on creating a cumulative frequency table for grouped data.
A standard frequency table usually contains three main parts: the frequency, the cumulative frequency, and class intervals for grouped data. Each part serves a different purpose, but together they provide a clear picture of how data is distributed.
Once you understand these components, performing a cumulative frequency calculation becomes much easier. If you’re unfamiliar with creating these tables, read our Cumulative Frequency Table guide for a detailed, step-by-step tutorial.
Takeaways
- A frequency table organizes raw data into a readable format.
- Frequency shows individual counts.
- Cumulative frequency shows running totals.
- Class intervals group large datasets into ranges.
Frequency
Frequency is the number of times a value appears in a dataset. It provides the basic information needed to summarize and analyze data. Every cumulative frequency calculation starts with accurate frequency values.
For example, imagine you record the test scores of 20 students. If the score of 80 appears five times, its frequency is 5. Each value or class interval has its own frequency, making it easy to see which values occur most often.
Expert Tip: Double-check your frequency counts before calculating cumulative frequency. Even one incorrect count can affect every running total that follows.
Cumulative Frequency
Cumulative frequency is the running total of all frequencies up to a specific value or class interval. You calculate it by adding each frequency to the previous cumulative total. This allows you to see how observations accumulate across the dataset.
For example, if the first three frequencies are 4, 6, and 5, the cumulative frequencies become 4, 10, and 15. Each new total includes all previous observations, making trends easier to identify.
Cumulative frequency is especially useful when finding percentiles, quartiles, medians, and creating cumulative frequency graphs (ogives). It also helps compare data distributions without reviewing every individual observation.
Pro Tip: The last cumulative frequency should always equal the total number of observations. If it doesn’t, review your calculations for mistakes.
Class Intervals (Grouped Data)
When a dataset contains many values, listing every value separately can make the table difficult to read. Instead, similar values are grouped into ranges called class intervals. Each interval has its own frequency and cumulative frequency.
For example, instead of recording every exam score individually, you might use intervals such as 0–10, 11–20, and 21–30. After counting the frequencies for each interval, you calculate the running totals to find the cumulative frequencies.
Grouped frequency tables make large datasets easier to organize and analyze. They are commonly used in statistics, education, research, surveys, and business reporting. If you’d like to learn how to build one from scratch, visit our Cumulative Frequency Table guide.
How to Calculate Cumulative Frequency (Step-by-Step)
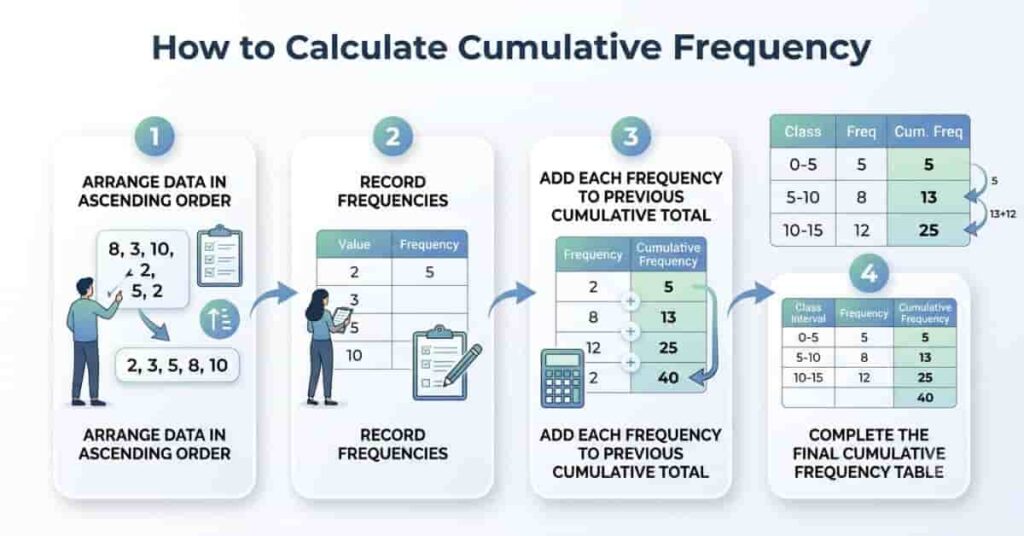
Learning how to calculate cumulative frequency is easier than it may seem. The process only requires a frequency table and simple addition. You start with the first frequency and keep adding each new frequency to the previous total. By the end, the last cumulative frequency equals the total number of observations in the dataset.
Follow these simple steps to calculate cumulative frequency correctly.
Step 1: Arrange the Data or Frequency Table
Begin by organizing your data in ascending order. If you’re working with grouped data, arrange the class intervals from the smallest range to the largest. Then, create a frequency table showing each value or class interval and its corresponding frequency.
A well-organized table helps you avoid mistakes and makes the calculation process much easier.
Step 2: Write the Frequency for the First Value
The first cumulative frequency is always the same as the first frequency because there are no previous values to add.
For example, if the first frequency is 4, the first cumulative frequency is also 4.
Step 3: Add Each New Frequency to the Previous Cumulative Total
Move to the next row and add its frequency to the previous cumulative frequency. Continue using the latest cumulative total for each new calculation.
For example:
- First cumulative frequency = 4
- Next frequency = 6
- New cumulative frequency = 4 + 6 = 10
- Next frequency = 5
- New cumulative frequency = 10 + 5 = 15
This running total continues until you reach the final row.
Step 4: Continue Until the Last Class or Value
Repeat the same process for every remaining value or class interval. The final cumulative frequency should equal the total number of observations in your dataset.
Here’s a simple example:
| Value | Frequency | Cumulative Frequency |
|---|---|---|
| 10 | 4 | 4 |
| 20 | 6 | 10 |
| 30 | 5 | 15 |
| 40 | 3 | 18 |
The total number of observations is 18, which matches the last cumulative frequency.
Expert Tip: Always review your final cumulative frequency. If it does not equal the total frequency, check your addition before using the results.
If you are working with spreadsheets, you can also learn how to calculate cumulative frequency in Excel using simple running-total methods.
Cumulative Frequency Formula
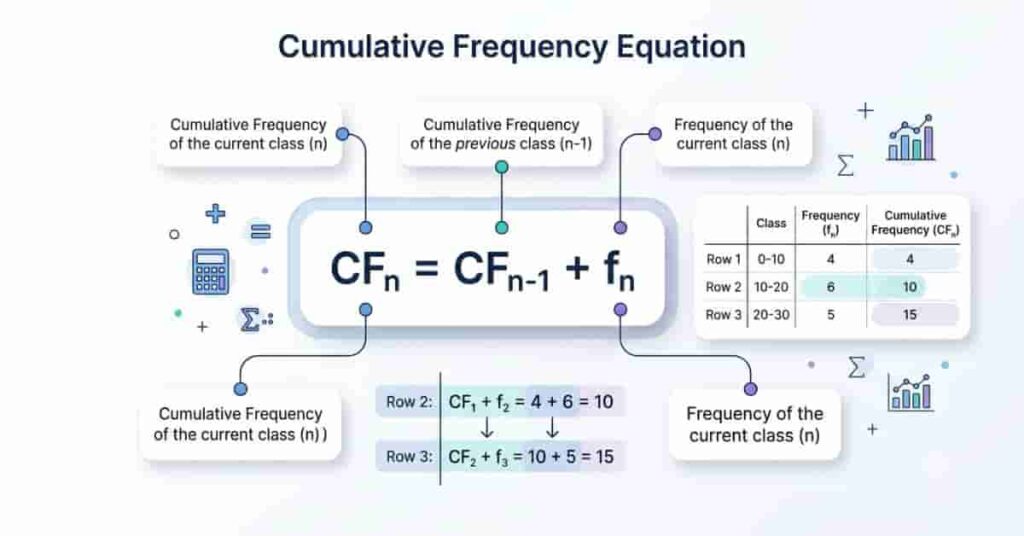
The cumulative frequency formula is based on a running total. Instead of using a complex calculation, you simply add the current frequency to the previous cumulative frequency.
Basic Formula
Cumulative Frequency (CF) = Previous Cumulative Frequency + Current Frequency
Or mathematically:
CFₙ = CFₙ₋₁ + fₙ
What Do the Variables Mean?
- CFₙ = Current cumulative frequency
- CFₙ₋₁ = Previous cumulative frequency
- fₙ = Frequency of the current value or class interval
The first cumulative frequency is a special case because there is no previous total. Therefore:
First Cumulative Frequency = First Frequency
Simple Example
Suppose you have the following frequencies:
| Value | Frequency |
|---|---|
| A | 3 |
| B | 5 |
| C | 4 |
| D | 2 |
Using the formula:
- CF₁ = 3
- CF₂ = 3 + 5 = 8
- CF₃ = 8 + 4 = 12
- CF₄ = 12 + 2 = 14
The final cumulative frequency is 14, which is also the total number of observations.
Worked Example: Calculating Cumulative Frequency
Now let’s apply everything you’ve learned with a complete example. This example shows how to calculate cumulative frequency using a simple grouped frequency table. Follow each step carefully, and you’ll see that the process only involves adding the frequencies one by one.
Example Frequency Table
| Class Interval | Frequency | Cumulative Frequency |
|---|---|---|
| 0–10 | 4 | 4 |
| 11–20 | 6 | 10 |
| 21–30 | 5 | 15 |
| 31–40 | 3 | 18 |
| 41–50 | 2 | 20 |
Step-by-Step Calculations
- First class (0–10):
Cumulative Frequency = 4 - Second class (11–20):
4 + 6 = 10 - Third class (21–30):
10 + 5 = 15 - Fourth class (31–40):
15 + 3 = 18 - Fifth class (41–50):
18 + 2 = 20
The final cumulative frequency is 20, which matches the total number of observations. This confirms that the calculation is correct.
Mini Case Study: Imagine a teacher groups the scores of 20 students into score ranges. Instead of counting every student repeatedly, the cumulative frequency column instantly shows how many students scored within or below each range. This makes it easier to analyze class performance and create cumulative frequency graphs.
How to Calculate Cumulative Frequency for Grouped Data
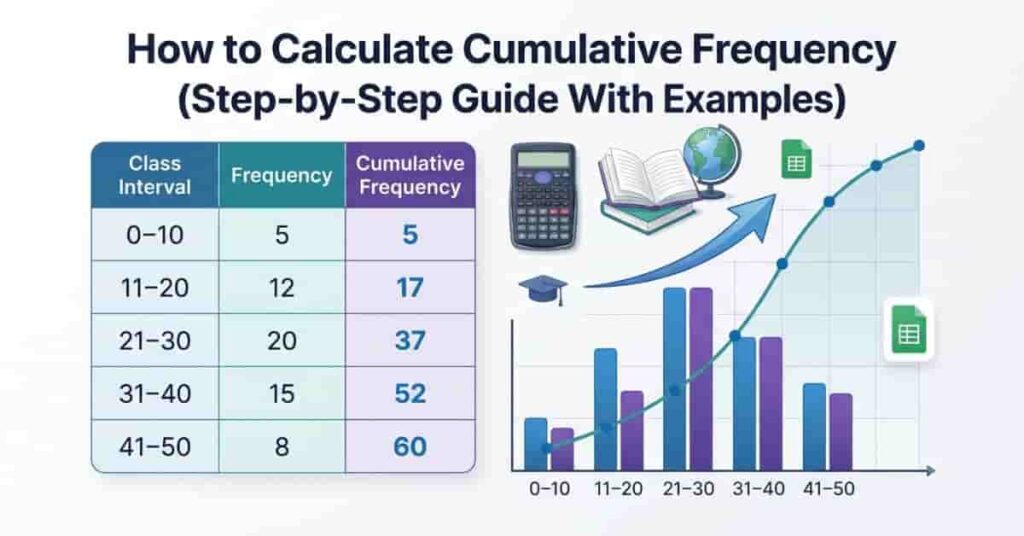
Grouped data combines similar values into class intervals, making large datasets easier to organize and analyze. The process to calculate cumulative frequency is the same as for ungrouped data. The only difference is that you work with class intervals instead of individual values.
Follow these three simple steps to calculate cumulative frequency for grouped data.
Step 1: Arrange the Class Intervals
List the class intervals in ascending order. Each interval should have the same width and should not overlap.
For example:
- 0–10
- 11–20
- 21–30
- 31–40
- 41–50
Step 2: List the Frequencies
Write the number of observations for each class interval in the frequency column.
| Class Interval | Frequency |
|---|---|
| 0–10 | 5 |
| 11–20 | 8 |
| 21–30 | 6 |
| 31–40 | 4 |
| 41–50 | 2 |
Step 3: Calculate the Running Totals
Start with the first frequency and keep adding the next frequency to the previous cumulative total.
| Class Interval | Frequency | Cumulative Frequency |
|---|---|---|
| 0–10 | 5 | 5 |
| 11–20 | 8 | 13 |
| 21–30 | 6 | 19 |
| 31–40 | 4 | 23 |
| 41–50 | 2 | 25 |
The last cumulative frequency is 25, meaning the dataset contains 25 observations.
Grouped frequency tables are widely used in statistics, research, education, business reports, and quality control because they summarize large datasets in a clear and organized way. If you want to learn how to build one from scratch, read our Cumulative Frequency Table guide for a complete walkthrough.
Expert Tip: Check that your class intervals are continuous and non-overlapping before calculating cumulative frequency. Incorrect intervals can lead to inaccurate results.
For a faster way to calculate running totals, try our Cumulative Frequency Calculator and get accurate results without doing each addition manually.
Cumulative Frequency vs Frequency
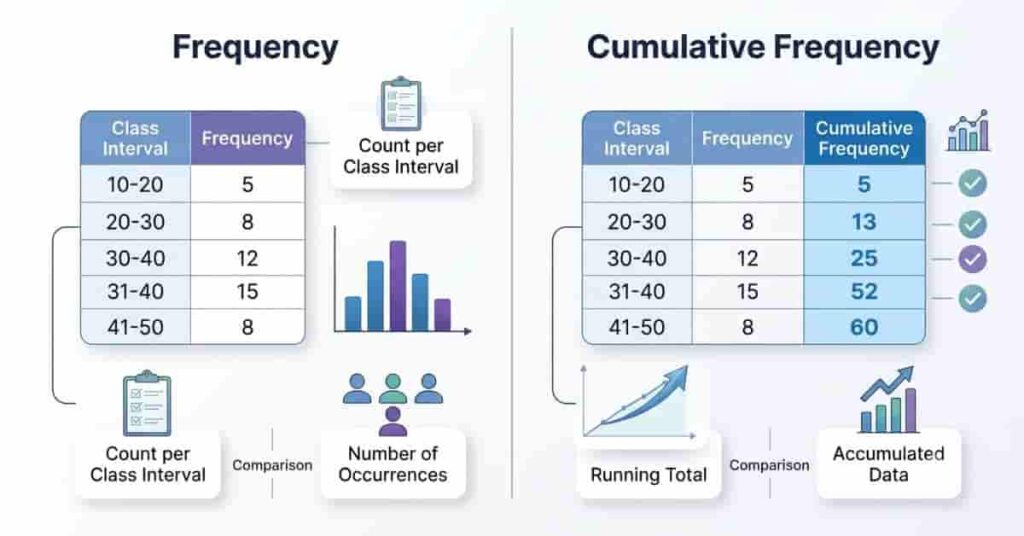
Although frequency and cumulative frequency are closely related, they serve different purposes. Frequency tells you how many times a value appears, while cumulative frequency shows the running total of all frequencies up to that value. Understanding this difference is essential when learning how to calculate cumulative frequency and interpret statistical data correctly.
The comparison below highlights the key differences.
| Feature | Frequency | Cumulative Frequency |
|---|---|---|
| Meaning | Individual count | Running total |
| Shows | Number of occurrences | Accumulated values |
| Calculation | Count each value separately | Add each frequency to the previous total |
| Values | Independent counts | Progressive totals |
| First Value | Actual frequency | Same as the first frequency |
| Final Value | Highest individual count | Total number of observations |
| Common Use | Frequency tables | Cumulative tables, ogives, percentiles, and quartiles |
Knowing the difference helps you read tables accurately and avoid calculation errors.
Common Mistakes When Calculating Cumulative Frequency
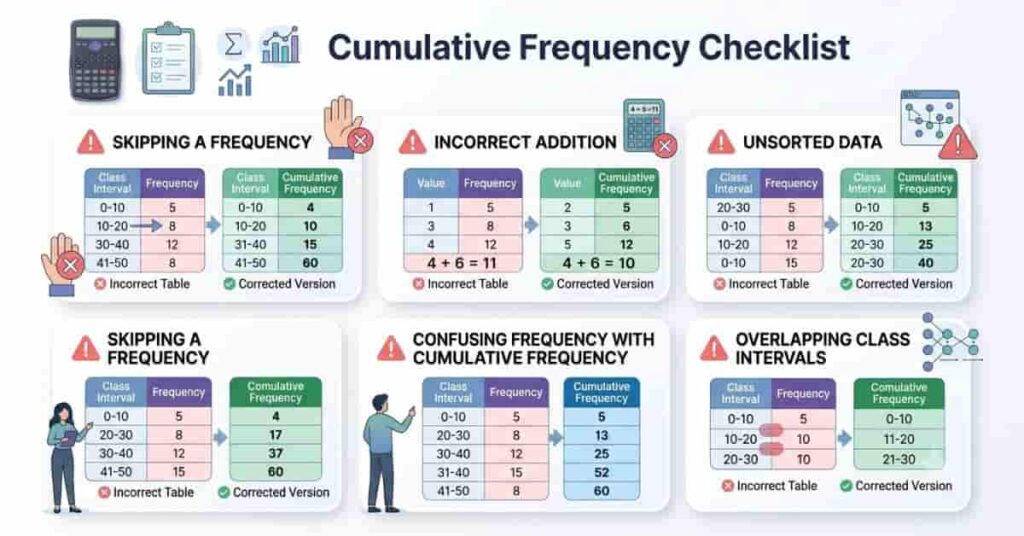
Even though cumulative frequency is easy to calculate, small mistakes can produce incorrect results. Understanding these common errors will help you complete your calculations with confidence.
1. Skipping a Frequency
Missing even one frequency changes every cumulative total that follows. Always check that every value or class interval is included.
2. Adding Values Incorrectly
Since cumulative frequency is a running total, one addition mistake affects the remaining calculations. Review each sum before moving to the next row.
3. Using Unsorted Data
Arrange values or class intervals in ascending order before you begin. Unsorted data creates incorrect running totals and misleading results.
4. Confusing Frequency with Cumulative Frequency
Frequency shows individual counts, while cumulative frequency combines all previous frequencies. Mixing these two columns is a common beginner mistake.
5. Using Incorrect Class Intervals
For grouped data, class intervals should be continuous and should not overlap. Poorly designed intervals can make your frequency table inaccurate.
How to Use Our Cumulative Frequency Calculator
Our Cumulative Frequency Calculator makes calculations fast and accurate. Instead of adding frequencies manually, you can generate a complete cumulative frequency table in seconds. It is ideal for students, teachers, researchers, and professionals who want reliable results.
Follow these simple steps:
- Enter your dataset or frequency values.
- Generate the frequency table.
- View cumulative frequencies instantly.
- Copy or export your results for reports or assignments.
The calculator automatically performs the running total calculation, helping you save time and reduce errors. Whether you’re working with simple or grouped data, it provides accurate results with just a few clicks.
Mini Case Study: A college student preparing for a statistics exam used the calculator to verify homework answers. Instead of checking every calculation manually, the student confirmed the results in seconds and focused on understanding the concepts.
Try our Cumulative Frequency Calculator to calculate cumulative frequencies instantly and eliminate manual calculation errors.
Applications of Cumulative Frequency
Cumulative frequency is widely used because it helps summarize data and reveal patterns that individual frequencies cannot show. It supports better decision-making in education, research, business, and many other fields.
Here are some common applications:
- Statistics: Calculate percentiles, quartiles, medians, and create cumulative frequency graphs.
- Classroom Assignments: Solve statistics problems and understand data distributions more easily.
- Surveys: Analyze responses and identify how results accumulate across categories.
- Business Reports: Track customer trends, sales performance, and operational data.
- Research: Summarize experimental and observational data for accurate analysis.
- Quality Control: Monitor production results and identify performance patterns over time.
- Data Analysis: Organize large datasets and compare distributions efficiently.
Understanding these applications helps you see why cumulative frequency is an important statistical tool beyond the classroom. Once you know how to calculate cumulative frequency, you can apply it confidently in academic, professional, and real-world situations.
Conclusion
Learning how to calculate cumulative frequency is easier when you understand that it is simply a running total of frequencies. In this guide, you learned the basic concept, the formula, step-by-step calculations, worked examples, and how to calculate cumulative frequency for grouped data. With a little practice, you’ll be able to solve frequency tables quickly and accurately.
If you want to save time or check your answers, try our Cumulative Frequency Calculator. It generates cumulative frequencies instantly and helps reduce calculation errors. For the next step in your learning journey, explore our guide on How to Create a Cumulative Frequency Table (Grouped Data Explained) to understand how frequency tables are built from raw data. If you found this guide helpful, share it with others or leave a comment below with your questions or experiences.
Frequently Asked Questions
1. What is cumulative frequency?
Cumulative frequency is the running total of frequencies in a dataset. It shows how many observations fall at or below a specific value or class interval. Unlike a regular frequency, which counts individual occurrences, cumulative frequency adds each frequency to the previous total. It is commonly used in statistics, research, education, and data analysis to understand how data accumulates.
2. How do you calculate cumulative frequency?
Arrange your data in ascending order and create a frequency table. Keep the first frequency unchanged, then add each new frequency to the previous cumulative total. Continue this process until the final value or class interval. The last cumulative frequency should always equal the total number of observations.
3. What is the formula for cumulative frequency?
Where:
- CFₙ = Current cumulative frequency
- CFₙ₋₁ = Previous cumulative frequency
- fₙ = Current frequency
The first cumulative frequency is simply the first frequency because there is no previous running total.
4. How is cumulative frequency different from frequency?
Frequency tells you how many times a specific value appears. Cumulative frequency is the running total of all frequencies up to a particular value or class interval. Frequency provides individual counts, while cumulative frequency shows accumulated counts across the dataset.
5. How do you calculate cumulative frequency for grouped data?
List the class intervals in ascending order and record the frequency for each interval. Start with the first frequency, then add each new frequency to the previous cumulative total. Continue until the last class interval. The final cumulative frequency represents the total number of observations in the grouped dataset.
6. Can cumulative frequency ever decrease?
No. Cumulative frequency cannot decrease because each new value is added to the previous running total. It either increases or stays the same if a class interval has a frequency of zero. A decreasing cumulative frequency usually indicates a calculation error.
7. Why is cumulative frequency useful in statistics?
Cumulative frequency helps summarize data and makes it easier to identify trends and patterns. It is widely used to calculate percentiles, quartiles, medians, and cumulative frequency graphs (ogives). Students, researchers, businesses, and analysts also use it to interpret large datasets more efficiently.
8. Can Excel calculate cumulative frequency?
Yes. Excel can calculate cumulative frequency using simple formulas. You can create a running total by adding each frequency to the previous cumulative frequency with formulas such as =C2+B3. Excel also supports charts and tables for cumulative frequency analysis. If you want an even faster solution, use our online Cumulative Frequency Calculator.
9. What is the last cumulative frequency equal to?
The last cumulative frequency is always equal to the total number of observations in the dataset. If your final cumulative frequency does not match the total frequency, review your frequency counts and calculations for possible errors.
10. Is there an online Cumulative Frequency Calculator?
Yes. Our online Cumulative Frequency Calculator lets you calculate cumulative frequency instantly. Simply enter your dataset or frequency values, and the tool automatically generates a complete frequency table with cumulative frequencies. It is ideal for students, teachers, researchers, and professionals.
11. Why should data be arranged before calculating cumulative frequency?
Data should always be arranged in ascending order before calculating cumulative frequency. Ordered data ensures that each running total correctly represents all observations up to that value or class interval. Unsorted data can produce incorrect results.
12. What is the first cumulative frequency?
The first cumulative frequency is always the same as the first frequency in the table. Since there are no previous values to add, the running total begins with the first observation count.
13. What is a cumulative frequency table?
A cumulative frequency table displays values or class intervals, their frequencies, and the running total of those frequencies. It makes large datasets easier to understand and prepares the data for cumulative frequency graphs and statistical analysis.
14. What is the difference between cumulative frequency and cumulative relative frequency?
Cumulative frequency shows the running total of observations. Cumulative relative frequency shows the running percentage or proportion of observations. It is calculated by dividing each cumulative frequency by the total number of observations.
15. When should you use a cumulative frequency table?
You should use a cumulative frequency table when analyzing ordered data, grouped datasets, survey responses, exam scores, business reports, or research findings. It helps summarize data and supports calculations such as medians, quartiles, percentiles, and cumulative frequency graphs.

Team ClassRank builds smart, student-friendly calculators to make grade and rank tracking simple and accurate. For questions or feedback, contact us at classrankcalculator@gmail.com.

