
Introduction
Ever felt confused by how data is grouped in a frequency table?
Understanding class width in statistics is the first step to making sense of grouped data. Many beginners in the USA struggle with frequency distributions because even a small mistake in the class width can change the interpretation of the results. This often leads to incorrect analysis in exams, assignments, and real-world data work.
Class width refers to the size of each group, or interval, into which data is divided in a frequency table. It decides how data is organized into equal intervals. It directly affects how clearly you can read patterns and trends in statistics. Without a correct class width, even simple datasets can become misleading or hard to understand. That is why mastering this concept is so important for students learning statistics for the first time.
In this article, you’ll unlock what class width means, see why it matters in frequency distributions, and learn to calculate it step by step. Plus, practical examples will turn abstract ideas into a clear, confident understanding you can use right away.
Want to check your answers instantly? Try our class width calculator to calculate intervals quickly and avoid common mistakes.
What is Class Width in Statistics?
Class width in statistics refers to the size of each interval in a grouped frequency distribution. In simple terms, it shows how far apart the lower and upper class limits are. It helps organize raw data into clear, equal groups, making patterns easier to understand. Many beginners try to calculate class width in statistics without fully understanding how it affects the data’s structure.
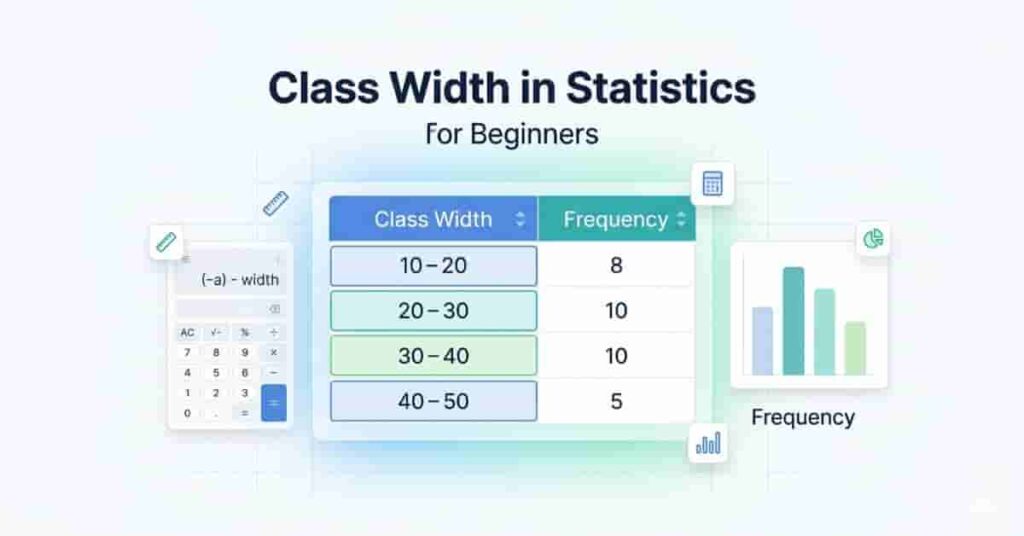
For example, imagine exam marks grouped into intervals like 10–20, 20–30, 30–40, and so on. Each interval has the same width, the class width. In this case, the class width is 10 because each group spans 10 marks. The same idea applies to ages, income ranges, or survey data in real-world statistics.
Below is a simple frequency table example:
| 10 – 20 | 5 |
| 20 – 30 | 8 |
| 30 – 40 | 6 |
Here, each class interval has equal width, making it easier to analyze the distribution.
Grasping this idea is vital for calculating class width in statistics, as it ensures data are grouped precisely and interpreted with clarity.
If you’re new to this concept, start with this simple class width calculator to quickly understand the basics.
Class Width Formula in Statistics
The class width formula in statistics is used to find the size of each interval in a grouped frequency distribution. It shows how wide each class is and helps keep all data groups consistent. When you calculate class width in statistics, you ensure that the data is organized in a structured, readable way.
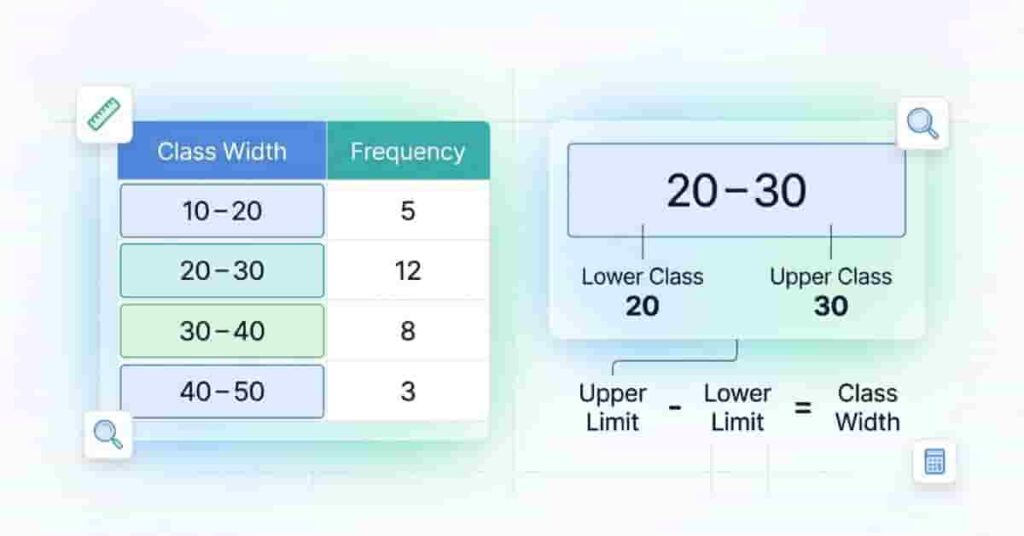
Formula:
Class Width = Upper Limit − Lower Limit
This formula is simple but very important in statistical calculations. It helps you divide data into equal parts, allowing patterns to be clearly identified without confusion.
For example, consider a grouped dataset of student marks:
- 10–20
- 20–30
- 30–40
Now apply the formula:
Class Width = 20 − 10 = 10
So, each class has a width of 10 marks. This same method applies to other datasets, such as age groups, income groups, or survey results. Keeping the class width equal ensures accurate frequency distribution tables and prevents misleading interpretations of the data.
Understanding this formula makes it much easier to correctly and confidently calculate class width in statistics, without errors in grouping.
How to Calculate Class Width in Frequency Distribution
Calculating class width in a frequency distribution is a simple step-by-step process that helps you organize data into equal intervals. When you calculate class width correctly in a frequency distribution, your data becomes easier to read, compare, and analyze. This also improves accuracy when working with grouped data in statistics.
Step 1 – Identify Class Limits
Start by looking at your grouped data table. Identify the lower and upper limits of each class interval. For example, if your data is arranged as 10–20, 20–30, and 30–40, then these values represent your class limits. This step is important because it helps you understand how your data is structured before applying any formula. Without the correct identification of class limits, calculating class width can lead to errors in interpretation.
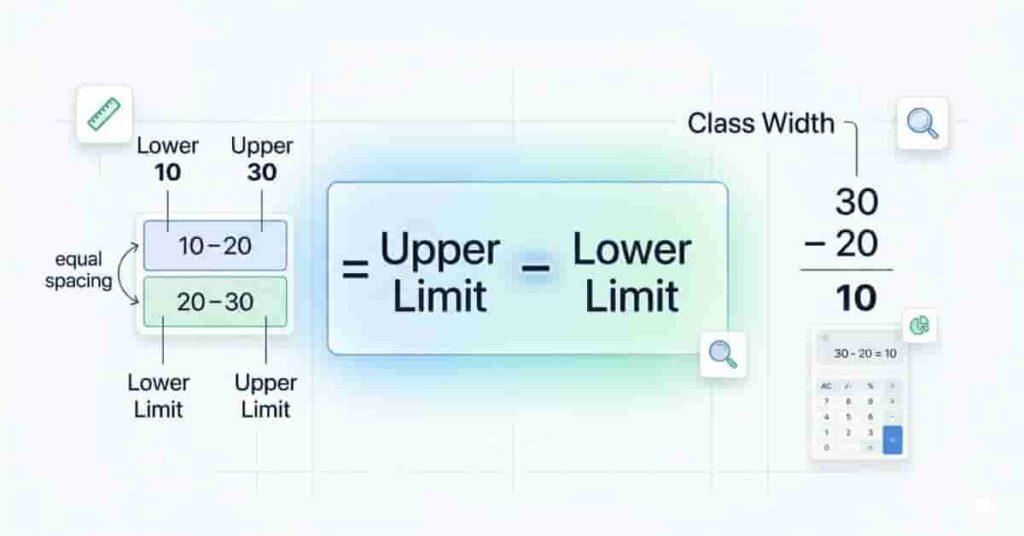
Step 2 – Apply Formula
Now use the basic formula:
Class Width = Upper Limit − Lower Limit
For example, in the interval 20–30:
Class Width = 30 − 20 = 10
So, each class has a width of 10. This step is essential for calculating class width in statistics because it ensures all intervals are evenly spaced and properly grouped.
Step 3 – Verify Consistency
After calculating, check all class intervals to make sure they have the same width. Equal intervals confirm that your frequency distribution is correctly structured. If any interval differs, it may indicate an error in grouping or calculation.
To better understand its impact, see how class width affects histogram shapes and data visualization.
Why Class Width Matters in Statistics (IMPORTANT)
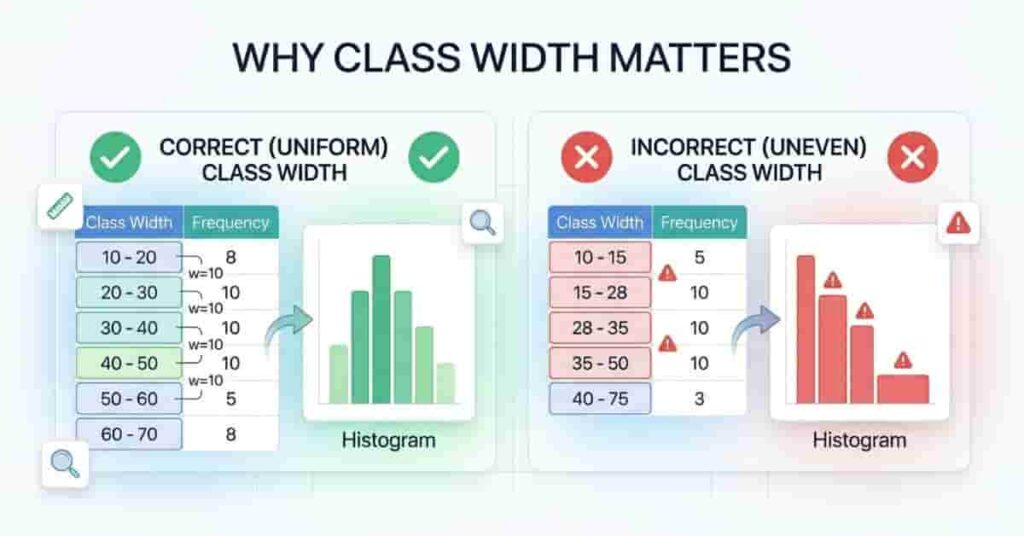
Class width plays a key role in how data is organized and understood in statistics. When you correctly calculate class width in statistics, it directly improves the quality of your frequency distribution. Even a small mistake in class width can change how the entire dataset is interpreted, especially for beginners in the USA who are learning grouped data for the first time.
One major reason class width matters is the accuracy of data grouping. Proper class width ensures that all values are placed in the correct intervals without overlap or confusion. This helps maintain clean, structured datasets, which are essential for accurate statistical results.
Another important factor is readability. When class widths are equal, frequency tables become easier to read and compare. This makes it simple to identify patterns, trends, and distributions in the data without extra effort.
Class width also strongly affects statistical analysis. Many calculations, such as the mean, median, and mode, depend on grouped data. If the class width is incorrect, these results can become misleading and reduce the reliability of your analysis.
Finally, it helps prevent errors. A correct class width reduces errors in grouping, calculation, and interpretation. It ensures your frequency distribution stays consistent and mathematically sound.
👉 Key Insight: Accurate class width is the foundation of reliable grouped data analysis.
Choosing the Right Class Width
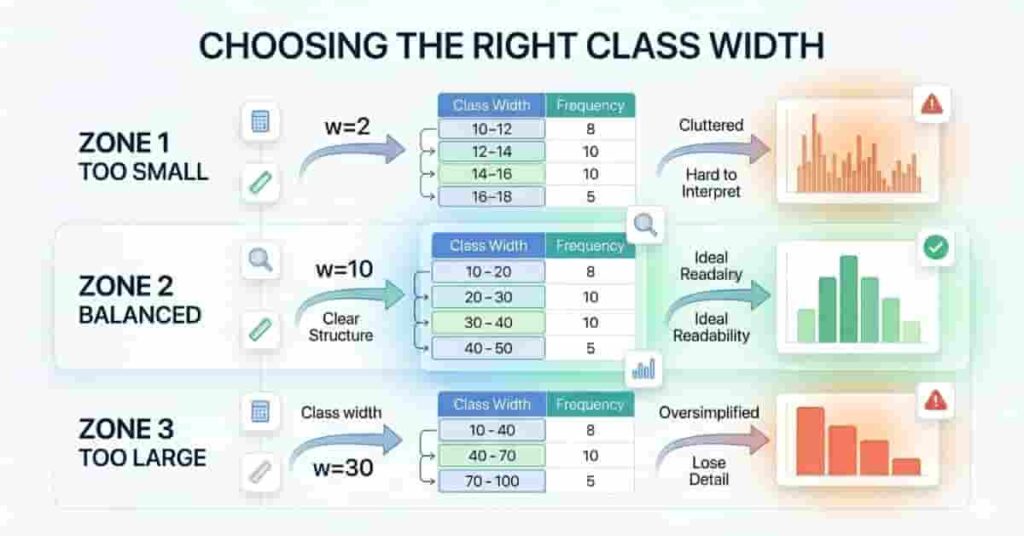
Choosing the right class width is one of the most important steps in building a clear frequency distribution. When you calculate class width in statistics, your final analysis depends heavily on how well you balance the interval sizes. A poor choice can either overload your data or hide important patterns.
If the class width is too small, you will end up with too many classes. This makes the table messy and harder to read. It also spreads the data too thinly, making patterns difficult to identify. Beginners often face confusion when there are too many small intervals in a single dataset.
On the other hand, if the class width is too large, you lose important details. The data becomes oversimplified, and small but meaningful differences disappear. This can lead to weak or misleading conclusions in statistical analysis.
The best approach is to use a balanced class width. It should be large enough to keep the table simple, but small enough to show clear patterns in the data. A common rule is to choose a width that yields a reasonable number of classes, typically 5-10 intervals, depending on the dataset size.
👉 Simple Rule: Always aim for clarity, not complexity, when setting class width in frequency distributions.
Class Width in Frequency Distribution Tables
A frequency distribution table becomes meaningful only when the class width is consistent and well-structured. When you understand class width frequency distribution, you can clearly see how data is grouped and how values are spread across intervals. This helps beginners in the USA quickly interpret statistical data without confusion.
In a frequency distribution table, each class interval must have equal spacing. This means the difference between the lower and upper limits remains the same across all groups. Equal spacing ensures that the data is fairly distributed and easy to compare across all classes.
For example, consider the following structured table:
| 10 – 20 | 5 |
| 20 – 30 | 8 |
| 30 – 40 | 6 |
| 40 – 50 | 4 |
Here, each interval has a class width of 10. This equal spacing makes it easy to spot trends, such as which range has the highest frequency or how values are distributed overall.
Without proper class width, the table can become uneven and misleading. That is why maintaining equal intervals is essential for accurate statistical interpretation and smooth data comparison.
👉 Key Insight: A well-structured frequency distribution table always depends on a consistent class width.
Using a Class Width Calculator in Statistics
A class width calculator in statistics is a helpful tool when you are working with large datasets. It quickly helps you determine the correct class width without having to perform manual calculations every time. This is especially useful when you need to calculate class width in statistics for multiple frequency distributions or complex data.
One major benefit is quick verification. Instead of checking each step manually, you can instantly confirm whether your class width is correct. This saves time and reduces confusion, especially for beginners who are still learning how grouped data works.
Another important advantage is error reduction. In large datasets, manual calculation mistakes are common. A calculator helps minimize these errors and ensures that your frequency distribution remains accurate and consistent. This leads to more reliable statistical results and better data interpretation.
Overall, a class width calculator is not about replacing learning but about supporting it. It helps you practice faster and check your work with confidence.
Tip: If you often work with grouped data or assignments, using a calculator can make your learning process smoother and more accurate.
Real-Life Examples in Statistics
Class width is not just a classroom concept. It is widely used in real-world data analysis. When you calculate class width in statistics, you are actually preparing data in a way that helps organizations, researchers, and students understand large datasets more clearly.
One common example is the distribution of exam marks. Schools often group student scores into intervals like 0–10, 10–20, or 20–30. This helps teachers quickly see how many students fall into each performance range. Instead of checking each score individually, grouped data makes analysis faster and more meaningful.
Another example is survey data. Suppose a company collects feedback ratings from 1 to 100. They can group responses into intervals like 0–25, 25–50, 50–75, and 75–100. This makes it easier to understand customer satisfaction levels and identify overall trends without analyzing each response individually.
Class width is also used in population grouping. Governments and researchers divide age groups like 0–10, 10–20, 20–30, and so on. This helps in planning education, healthcare, and employment policies based on age distribution.
These examples show how class width supports clear and organized data analysis in everyday life. Without proper grouping, large datasets would be difficult to interpret and use effectively.
Common Mistakes in Statistical Calculations
Many students make simple mistakes when working with grouped data. These errors can affect the accuracy of results, especially when you calculate class width in statistics. Understanding these mistakes helps you avoid confusion and improve your data interpretation skills.
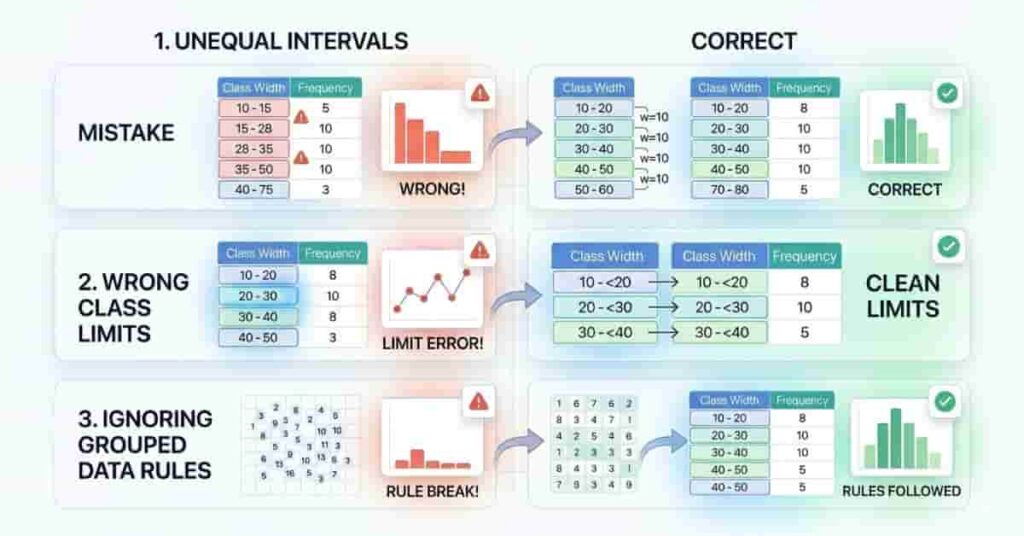
One common mistake is using unequal intervals. When class widths are not equal, the frequency distribution becomes unbalanced. This makes it hard to compare groups and can lead to incorrect conclusions. Always ensure that each class has the same width unless the data specifically requires otherwise.
Another frequent error is selecting wrong class limits. Students sometimes overlap intervals or leave gaps between classes. For example, using 10–20 and 20–30 without clear rules can lead to confusion about data placement. Proper class limits should be consistent and clearly defined to avoid overlap or missing values.
A third mistake is ignoring the rules for grouped data. Some learners treat grouped data as raw data, leading to incorrect calculations. In statistics, grouped data follow specific rules for intervals, frequency, and class width that must be carefully adhered to.
Avoiding these mistakes ensures your frequency distribution remains accurate and easy to interpret. It also improves your overall understanding of statistical concepts.
Conclusion
Class width plays a key role in building clear and accurate frequency distributions in statistics. In this article, we covered its meaning, formula, calculation steps, real-life use cases, and common mistakes to avoid. Understanding this concept helps beginners handle grouped data with more confidence and accuracy.
Mastering class width in statistics improves how you organize and interpret data in tables and charts. It also supports better decision-making when analyzing frequency distributions in real-world problems.
If you are still practicing, keep applying these steps with different datasets. The more you practice, the easier it becomes to spot correct intervals and avoid errors in calculations.
👉 Share this guide with classmates who struggle with grouped data. You can also explore our other statistics resources or try our calculator to verify your answers instantly.
Team ClassRank builds smart, student-friendly calculators to make grade and rank tracking simple and accurate. For questions or feedback, contact us at classrankcalculator@gmail.com.