
Introduction
Struggling to find class width quickly?
A class width calculator quickly finds the difference between class limits. This is a basic part of statistics when you use grouped data or frequency tables. Many beginners in the USA get confused doing it by hand, especially under time pressure.
Instead of memorizing formulas or making mistakes, you can use a simple tool for quick answers. This guide mixes a fast calculator with easy steps, so you learn both the shortcut and the method.
Ready for a master class with? Use the calculator and follow the guide’s steps now to boost your statistics skills.
What is a Class Width Calculator?
A class width calculator eliminates manual errors and saves time by quickly finding class interval width. It’s used in basic statistics for grouped data and frequency tables, especially by beginners during homework or exams.
Instead of doing calculations by hand, this tool provides instant, accurate results. A class interval calculator follows a simple rule and applies it automatically, so you don’t have to remember formulas every time.
How does it work?
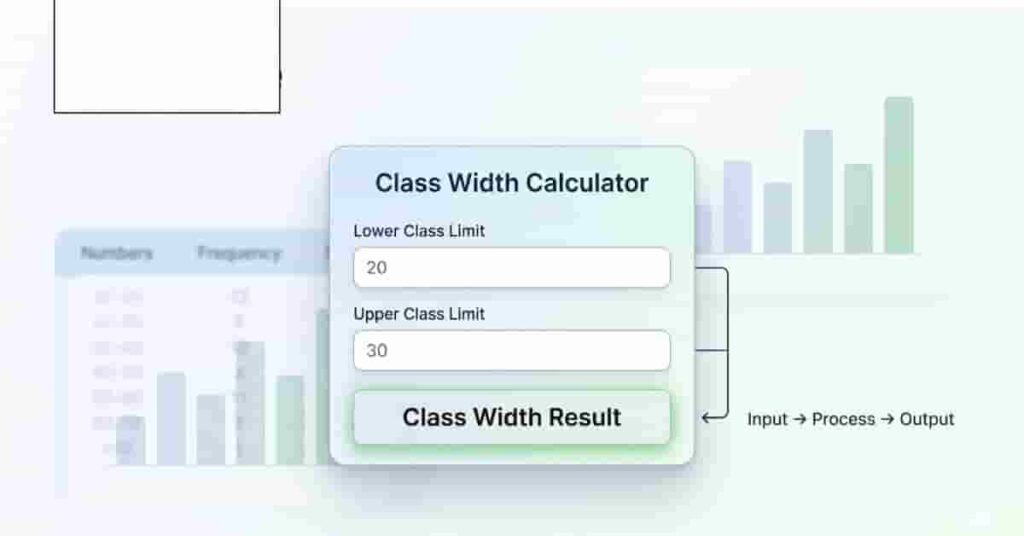
A class width calculator needs just two inputs:
- Lower class limit – the starting value of the interval
- Upper class limit – the ending value of the interval
Enter these values, and the calculator quickly shows the result.
What does it give as output?
The output is the class width, the difference between the upper and lower limits. This value shows the width of each class interval in a dataset.
Using a class width calculator makes statistics easier, faster, and more reliable, especially for beginners.
If you want to understand how class width actually works in grouped data, this guide on class width in statistics explains frequency distributions in a simple way.
Class Width Formula (Simple Explanation)
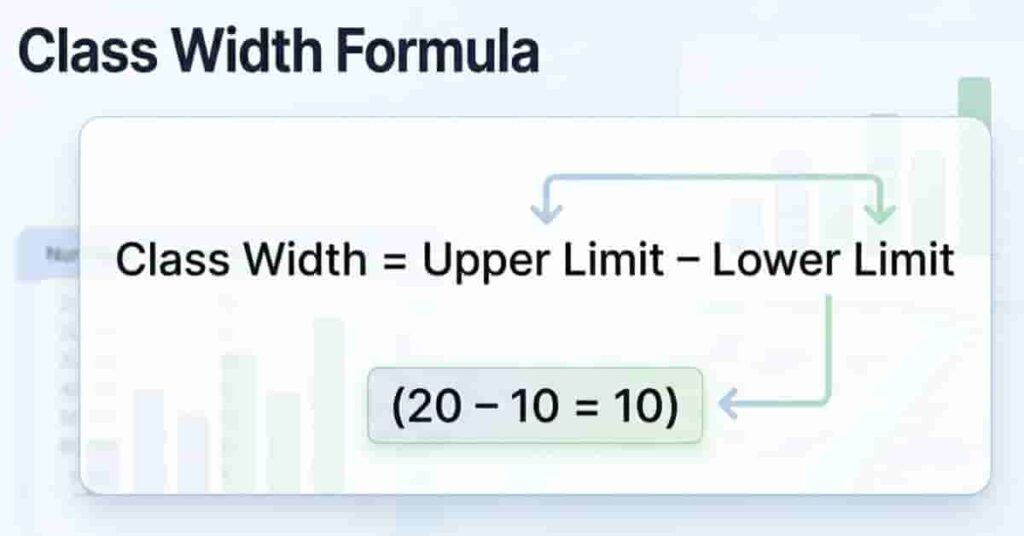
The formula to calculate the width of a class interval is very simple and easy to remember. You only need to subtract the lower limit from the upper limit. This gives you the size (width) of that class.
📌 Formula
This formula works for most basic statistics problems and is commonly used in schools across the USA.
📊 Simple Example
Let’s say your class interval is 10–20.
- Upper limit = 20
- Lower limit = 10
Now subtract:
20−10=1020 – 10 = 1020−10=10
So, the class width is 10.
This quick method helps you avoid confusion and makes it easier to handle grouped data. Once you understand this, you can solve most class interval problems in seconds.
How to Calculate Class Width (Step-by-Step)
Calculating class width is simple when you follow clear steps. You only need the class limits and basic subtraction. This method works for most beginner-level statistics problems and helps you avoid confusion during exams.
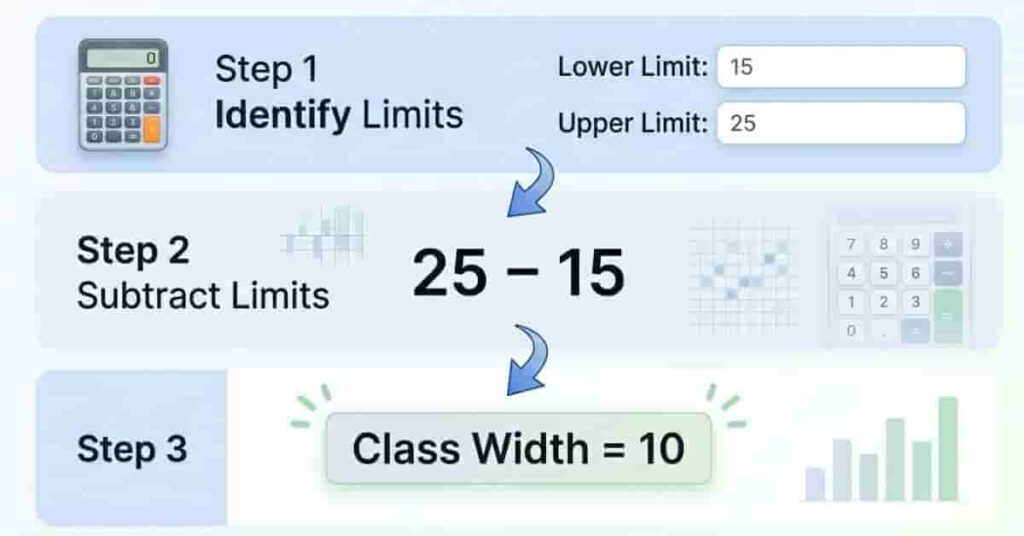
Step 1 – Identify Lower & Upper Limits
First, determine the lower and upper limits of the class interval. These are the group’s starting and ending values.
For example, in the interval 15–25:
- Lower limit = 15
- Upper limit = 25
Make sure you read the interval correctly. Many students mix up limits when working quickly, especially in tests.
Step 2 – Apply the Formula
Now, subtract the lower limit from the upper limit. This gives you the class width.
Using the same example:
- 25 − 15 = 10
So, the class width is 10.
This step is quick and works the same way for any class interval. Once you practice it a few times, it becomes very easy.
Step 3 – Verify Your Answer
Always double-check your answer to avoid small mistakes. Simple errors can lead to wrong results in larger problems.
Common mistakes to avoid:
- Using the wrong limits
- Adding instead of subtracting
- Mixing class width with class interval
A quick recheck ensures your answer is correct and builds confidence.
How to Use Our Class Width Calculator
Using our class width calculator is the fastest way to get accurate results without doing manual work. It is designed for beginners, so you can use it in seconds without any confusion. No formulas to memorize, no errors to worry about.
Step-by-Step Guide
Follow these simple steps:
- Step 1: Enter the lower limit
Type the starting value of your class interval. - Step 2: Enter upper limit
Add the ending value of the interval. - Step 3: Click calculate
Hit the calculate button to process your input. - Step 4: Get instant results
The tool will immediately show the class width.
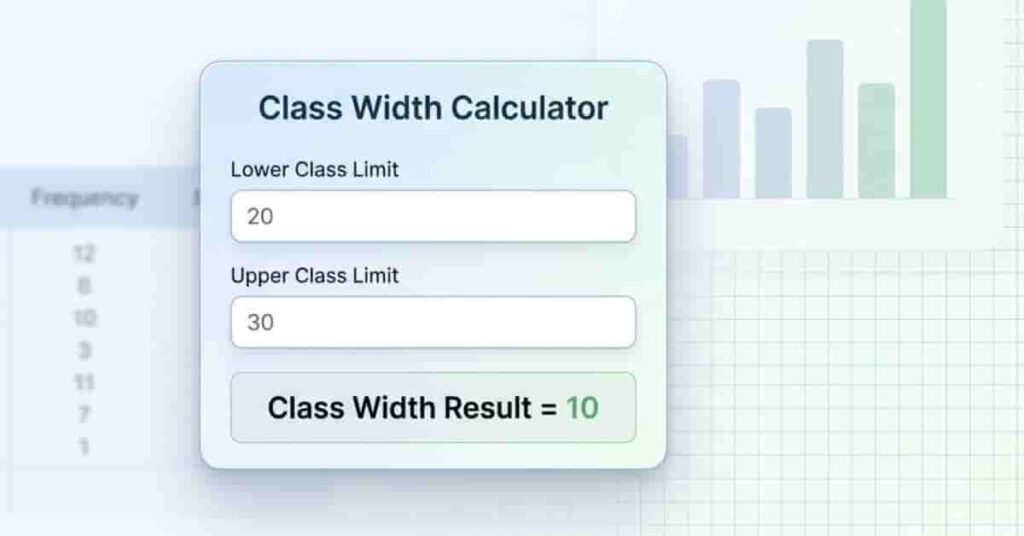
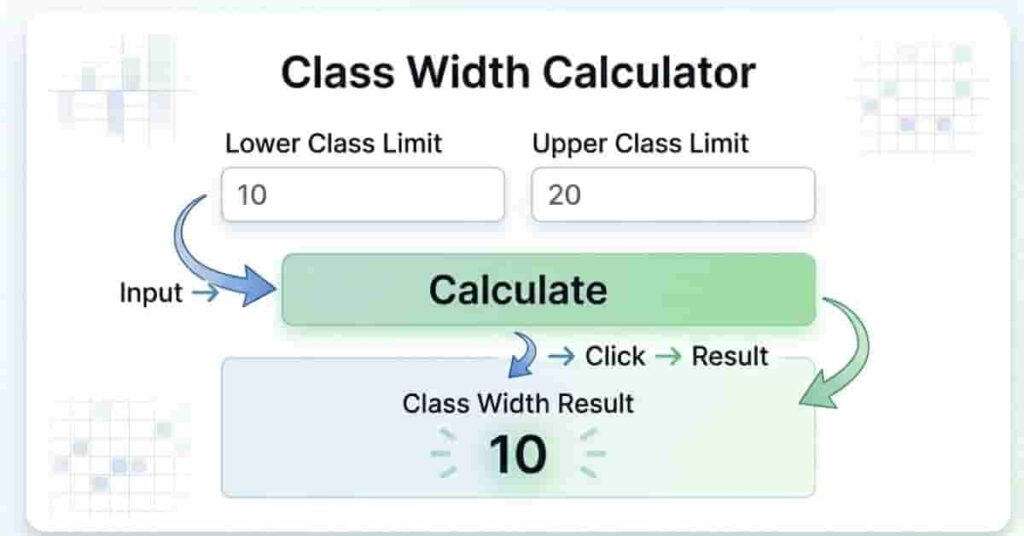
📊 Example (Input → Output)
Let’s say you enter:
- Lower limit = 10
- Upper limit = 20
👉 Output: Class Width = 10
You get the correct answer instantly, without doing any subtraction yourself.
🚀 Why Use This Calculator?
- Instant result in seconds
- No signup required
- Works on mobile and desktop
- 100% accurate for basic calculations
👉 Try it now and save time on your assignments and exams. This class interval calculator makes statistics quick, simple, and stress-free.
Class Width Example (Beginner-Friendly)
Understanding class width becomes much easier when you see simple examples. Let’s look at two basic cases that beginners often face in statistics.
Example 1: Simple Numeric Interval
Suppose you have a class interval of 30–40.
- Lower limit = 30
- Upper limit = 40
Now subtract:
- 40 − 30 = 10
👉 So, the class width is 10.
This is the most common type of question in school exams. Once you know the limits, the answer is quick and easy.
Example 2: Small Interval Table
Now let’s look at a small grouped data table:
| 10–20 | 10 |
| 20–30 | 10 |
| 30–40 | 10 |
In this table, each interval has the same width. You can see that every class increases by 10.
👉 This shows that class width is often equal across all intervals in a dataset. This makes data easier to read and organize.
✅ Key Takeaway
In most beginner problems, the class width stays the same for all intervals. Just find the difference once, and you can apply it to the rest.
Class Width vs Class Interval (Quick Difference)
Many beginners confuse class width with class interval, but they are not the same. Both are used in statistics, especially when working with grouped data. Understanding the difference helps you solve problems faster and avoid mistakes in exams.
📊 Quick Comparison Table
| Class Width | The difference between the upper and lower limits |
| Class Interval | The full range between two limits (e.g., 10–20) |
🔍 Simple Explanation
A class interval shows the range of values in a group. For example, 10–20 is a class interval. It tells you where the data falls.
A class width, on the other hand, is just the size of that range. In the same example:
- 20 − 10 = 10
👉 So, the class width is 10
This is why many students search for the difference between class width and class interval. The interval is the range, while the width is the size of that range.
🎯 Why This Difference Matters
- Helps you understand grouped data clearly
- Prevents confusion in formulas
- Makes solving statistics problems faster
If you remember this simple idea, you’ll never mix up class width vs class interval again.
Why Class Width is Important
Class width plays a key role in basic statistics. It helps you organize data into clear groups, making large datasets easier to handle. Without proper class width, your data can look messy and hard to understand.
📊 Better Data Grouping
Class width helps divide data into equal intervals. This makes it easier to create frequency tables and charts.
For example, using equal-width intervals like 10–20, 20–30, and 30–40 keeps the data consistent. It also helps you compare values quickly without confusion.
👀 Improves Readability
When class widths are clear and consistent, your data is easier to read. Students and teachers can quickly understand patterns without extra effort.
If intervals are uneven, the data may look confusing and harder to analyze. That’s why choosing the right width matters.
📘 Builds Basic Statistics Understanding
Learning class width helps you understand core concepts in statistics. It is often used in:
- Frequency distribution tables
- Histograms and graphs
- Grouped data analysis
Once you understand class width, many other topics become easier to learn.
✅ Key Takeaway
Class width makes data simple, organized, and easy to understand. It is a small concept with a big impact on statistics.
You can also see how class width is applied in histograms to turn raw numbers into clear visual insights.
Common Mistakes to Avoid
Many students lose marks in statistics due to minor mistakes in class width calculations. These errors are easy to avoid if you know what to look for. Understanding them will help you get accurate results every time.
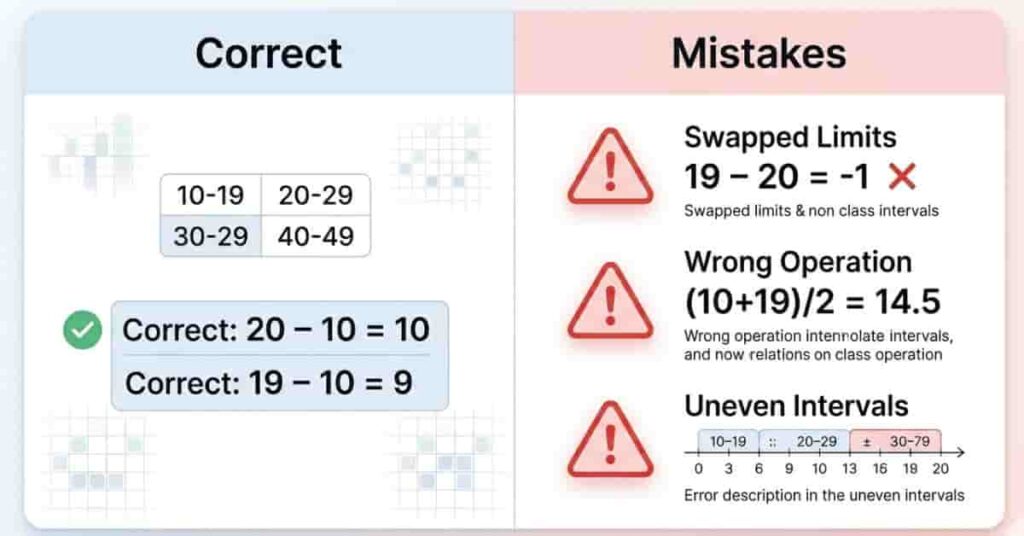
❌ Wrong Limits
One of the most common mistakes is choosing the wrong values. Students often confuse the lower and upper limits.
For example, in 10–20:
- Lower limit = 10
- Upper limit = 20
If you swap them, your answer will be incorrect. Always double-check the interval before calculating.
⚠️ Unequal Intervals
Another mistake is using uneven class intervals in the same dataset. This makes the data harder to analyze and more confusing.
For example:
- 10–20
- 20–35
- 35–40
These are not equal, so comparisons become unreliable. In most basic statistics problems, intervals should stay consistent.
📉 Formula Misuse
Some students incorrectly add values rather than subtract them. The correct rule is simple:
👉 Class Width = Upper Limit − Lower Limit
Using the wrong operation yields incorrect answers, even if the numbers are correct.
🎯 Key Takeaway
Always check your limits, keep intervals equal, and use the correct formula. These small steps can help you avoid common mistakes and improve your statistical accuracy.
Conclusion
In this guide, we covered how class width works in simple statistics. You learned the formula, step-by-step method, examples, and common mistakes to avoid. Now you can easily handle grouped data without confusion.
A class width calculator makes this process even faster by providing instant, accurate results. It removes manual errors and helps beginners understand data grouping more clearly. This is especially useful when working with class interval calculator problems in exams or assignments.
If this guide helped you, feel free to share it with other students or classmates. You can also try our calculator and see how quickly it solves problems. Stay consistent, practice regularly, and keep improving your statistics skills with simple tools like this.
Team ClassRank builds smart, student-friendly calculators to make grade and rank tracking simple and accurate. For questions or feedback, contact us at classrankcalculator@gmail.com.