

Table of Contents
Introduction
Have you ever wondered why percentages often explain data better than simple counts? If you’re learning how to calculate relative frequency, you’re already taking an important step toward understanding statistics. Relative frequency shows how often a value appears compared to the entire dataset. This makes it much easier to compare results, even when datasets are different sizes.
Whether you’re a student, teacher, or beginner in the USA, knowing how to calculate relative frequency can help you analyze surveys, classroom assignments, business reports, and research data with confidence. Instead of focusing only on raw numbers, you’ll learn to interpret data as proportions or percentages, making trends easier to spot and explain.
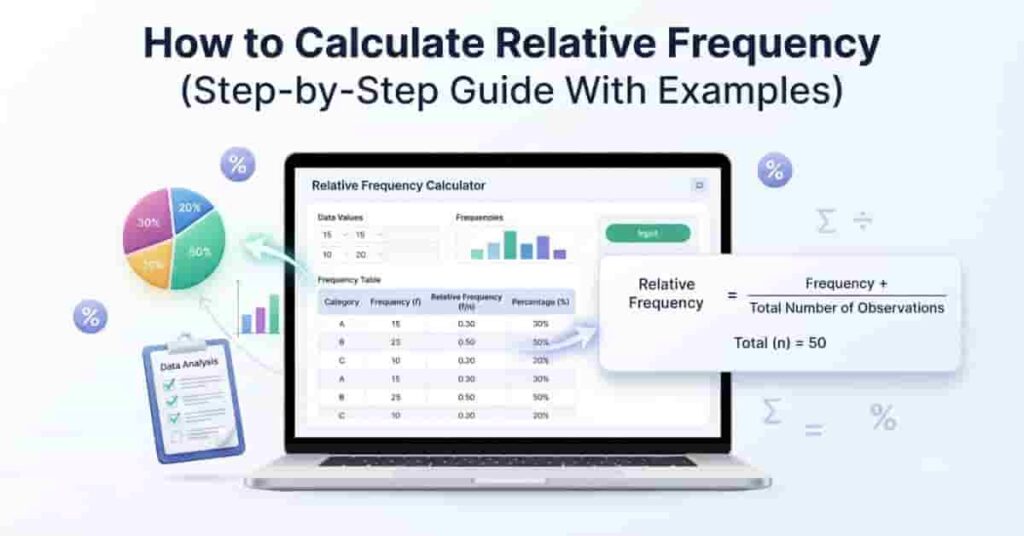
In this guide, you’ll learn the relative frequency formula, follow step-by-step calculations, and work through clear examples. You’ll also discover how do you calculate relative frequency correctly and avoid common mistakes. If you want faster results, you can instantly calculate relative frequency using our free Relative Frequency Calculator.
What Is Relative Frequency?
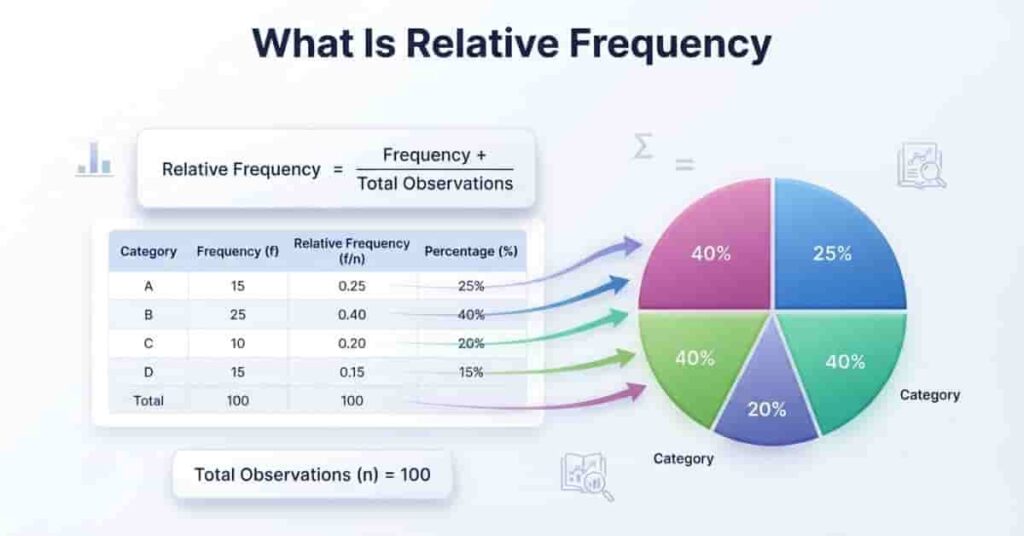
Relative frequency is a statistical measure that shows how often a value or category appears compared to the total number of observations. Instead of using raw counts, it expresses the result as a decimal, fraction, or percentage. This makes it easier to compare different datasets, even when they contain different numbers of observations.
After learning the calculation process, explore relative frequency distributions to understand how percentages are organized into tables and histograms.
If you’re learning how to calculate relative frequency, understanding this concept is the first step. Once you know the frequency of each value and the total number of observations, you can quickly find the relative frequency using a simple formula. This method helps you see the share of each value within the entire dataset.
For example, imagine a class of 30 students where 12 students chose science as their favorite subject. The frequency is 12, but the relative frequency is 12 ÷ 30 = 0.40, or 40%. This percentage gives a clearer picture than the raw count alone.
Relative frequency is widely used in statistics because it helps compare results fairly. Whether you’re analyzing survey responses, test scores, or sales data, it provides a standardized way to understand patterns and trends.
Takeaways
- Relative frequency shows the proportion of a value in a dataset.
- It is calculated using the frequency and total observations.
- Results can be written as decimals, fractions, or percentages.
- It makes comparing datasets much easier.
Expert Tip: Always check that all relative frequencies add up to 1.00 (or 100% when shown as percentages). If they don’t, review your calculations for errors.
Definition
Relative frequency is the proportion of times a value or category appears in a dataset. It is found by dividing the frequency of a value by the total number of observations.
Unlike frequency, which only tells you how many times something occurs, relative frequency shows its share of the whole dataset. You can express the result as a decimal, fraction, or percentage.
For example, suppose a survey includes 50 responses, and 15 people choose Option A. The relative frequency is 15 ÷ 50 = 0.30, or 30%. This tells you that three out of every ten respondents selected Option A.
Understanding this definition makes relative frequency calculation much easier. It also prepares you for creating frequency tables, charts, and probability distributions.
Pro Tip
Think of relative frequency as asking, “What portion of the total does this value represent?” This mindset makes calculations easier to understand.
Why Relative Frequency Is Important
Relative frequency helps you compare data accurately, even when datasets have different sizes. Raw counts alone can be misleading because larger datasets naturally have higher frequencies.
For example, imagine one survey has 100 responses and another has 1,000. A category with 80 responses may seem larger than one with 30 responses, but relative frequency reveals the true proportion in each dataset. This creates fair comparisons.
This measure also helps simplify data interpretation. Percentages and proportions are easier to understand than large numbers, especially when presenting information in reports, charts, or presentations.
Students, researchers, teachers, and business professionals all use relative frequency to identify trends, compare categories, and make informed decisions based on data.
Pro Tip
When comparing multiple datasets, use relative frequency instead of raw counts to avoid misleading conclusions.
When Is Relative Frequency Used?
Relative frequency appears in many fields because it helps summarize and compare data clearly. It turns raw numbers into meaningful proportions, making results easier to understand.
Common uses include:
- Statistics: Compare data distributions and identify trends.
- Classroom assignments: Analyze grades, attendance, or survey results.
- Surveys: Show the percentage of people selecting each response.
- Business reports: Compare sales, customer preferences, or market trends.
- Scientific research: Summarize experimental results and compare groups.
- Probability: Estimate the likelihood of future events based on observed data.
For example, a company may find that 45% of customers prefer online shopping. This percentage is much easier to interpret than simply stating that 450 out of 1,000 customers chose that option.
Understanding where relative frequency is used helps you apply it correctly in school, work, and everyday data analysis.
Relative Frequency Formula
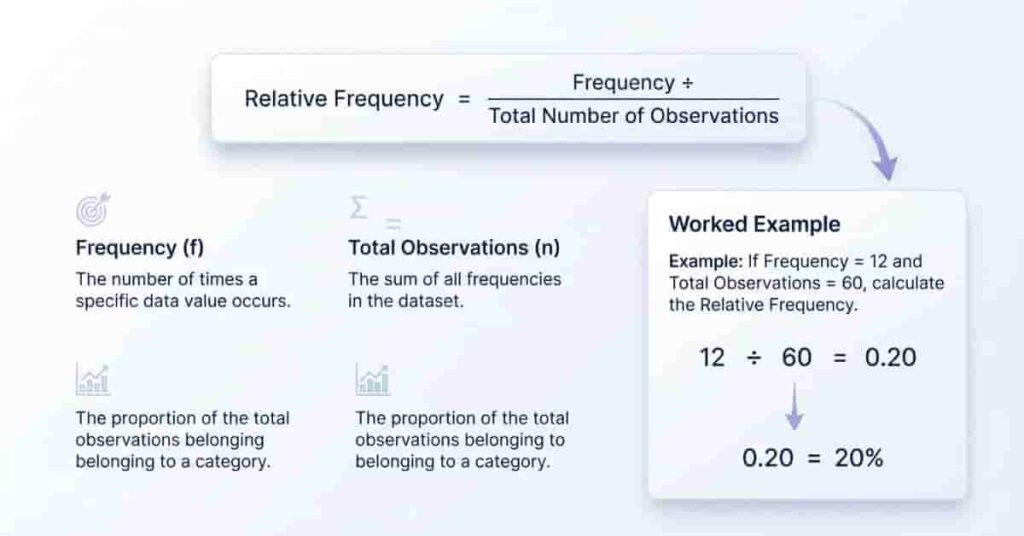
The relative frequency formula shows the proportion of a value within a dataset. It compares the frequency of a specific value to the total number of observations. If you’re learning how to calculate relative frequency in statistics, this is the only formula you need.
Prefer using spreadsheets? See how to calculate relative frequency in Excel with simple formulas, charts, and practical examples.
Formula
Relative Frequency = Frequency ÷ Total Number of Observations
Variable Definitions
- Relative Frequency: The proportion or share of a value in the dataset.
- Frequency: The number of times a value or category appears.
- Total Number of Observations: The total count of all values in the dataset.
The answer is usually written as a decimal. You can multiply it by 100 to convert it into a percentage.
Simple Example
Suppose a bag contains 25 marbles, and 5 of them are blue.
- Frequency of blue marbles = 5
- Total observations = 25
Relative Frequency = 5 ÷ 25 = 0.20
Percentage = 0.20 × 100 = 20%
This means 20% of the marbles are blue.
Expert Tip: Do not round your answers until you finish all calculations. Early rounding can make the total slightly different from 1.00 or 100%.
How to Calculate Relative Frequency (Step-by-Step)
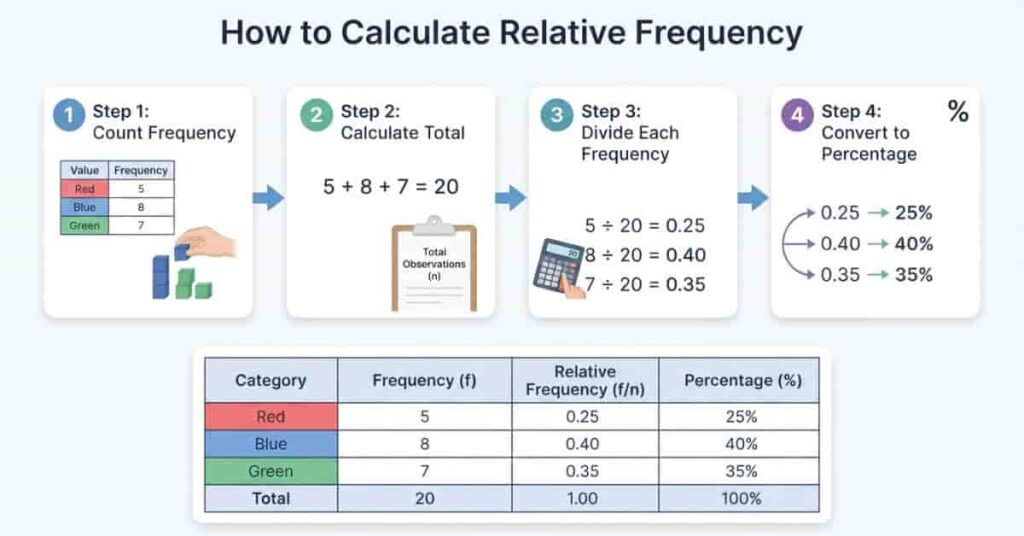
Learning how to calculate relative frequency is easier than it may seem. You only need the frequency of each value and the total number of observations. Once you have both, you can use the relative frequency formula to find the proportion or percentage for every value in your dataset.
To save time and avoid calculation errors, use our Relative Frequency Calculator for instant, accurate results with detailed tables.
Follow these four simple steps.
Step 1: Count the Frequency of Each Value or Class
Start by counting how many times each value or category appears in your dataset. This number is called the frequency.
For example, imagine you survey students about their favorite subject.
| Subject | Frequency |
|---|---|
| Math | 12 |
| Science | 10 |
| English | 8 |
Each number shows how many students selected that subject.
Step 2: Find the Total Number of Observations
Next, add all the frequencies together. This gives you the total number of observations.
Using the example above:
12 + 10 + 8 = 30
Your total number of observations is 30.
Step 3: Divide Each Frequency by the Total
Now divide each frequency by the total number of observations.
For example:
- Math: 12 ÷ 30 = 0.40
- Science: 10 ÷ 30 = 0.33
- English: 8 ÷ 30 = 0.27
These values represent the relative frequencies.
Step 4: Convert the Result to a Percentage (Optional)
If you want to express the results as percentages, multiply each relative frequency by 100.
- Math: 0.40 × 100 = 40%
- Science: 0.33 × 100 = 33%
- English: 0.27 × 100 = 27%
Percentages are often easier to understand when presenting data in reports, charts, or classroom assignments.
Worked Example
Suppose a teacher records the favorite fruit of 20 students.
| Fruit | Frequency | Relative Frequency | Percentage |
|---|---|---|---|
| Apple | 8 | 0.40 | 40% |
| Banana | 6 | 0.30 | 30% |
| Orange | 4 | 0.20 | 20% |
| Grapes | 2 | 0.10 | 10% |
| Total | 20 | 1.00 | 100% |
Notice that all relative frequencies add up to 1.00, and all percentages total 100%. This is a quick way to check that your relative frequency calculation is correct.
Worked Example: Relative Frequency Calculation
Let’s walk through a complete relative frequency calculation using a simple dataset. This example shows each step clearly, making it easy to understand how to calculate relative frequency in statistics.
Suppose a teacher surveys 40 students about their favorite school subject. The results are shown below.
| Subject | Frequency | Relative Frequency | Percentage |
|---|---|---|---|
| Math | 14 | 0.35 | 35% |
| Science | 10 | 0.25 | 25% |
| English | 8 | 0.20 | 20% |
| History | 5 | 0.125 | 12.5% |
| Art | 3 | 0.075 | 7.5% |
| Total | 40 | 1.00 | 100% |
Now calculate the relative frequency for each subject.
Step 1: Find the Total Number of Observations
Add all the frequencies.
14 + 10 + 8 + 5 + 3 = 40
The total number of observations is 40.
Step 2: Divide Each Frequency by the Total
Use the formula:
Relative Frequency = Frequency ÷ Total Number of Observations
For each subject:
- Math: 14 ÷ 40 = 0.35
- Science: 10 ÷ 40 = 0.25
- English: 8 ÷ 40 = 0.20
- History: 5 ÷ 40 = 0.125
- Art: 3 ÷ 40 = 0.075
Step 3: Convert to Percentages
Multiply each relative frequency by 100.
- Math: 35%
- Science: 25%
- English: 20%
- History: 12.5%
- Art: 7.5%
The percentages add up to 100%, confirming the calculations are correct.
What Does This Result Mean?
The table shows that Math is the most popular subject because it has the highest relative frequency of 0.35, or 35%. In contrast, Art has the lowest share at 7.5%. Relative frequency makes these comparisons much easier than using raw counts alone.
Relative Frequency vs Frequency
Although the terms frequency and relative frequency are closely related, they measure different things. Frequency tells you how many times a value appears, while relative frequency shows what portion of the entire dataset that value represents.
Understanding this difference helps you choose the right measure when analyzing or comparing data. Raw counts are useful for recording observations, but relative frequencies provide a clearer picture when datasets have different sizes.
| Frequency | Relative Frequency |
|---|---|
| Raw count of occurrences | Proportion of the total dataset |
| Expressed as whole numbers | Expressed as a decimal, fraction, or percentage |
| Shows how many times a value appears | Shows the share or likelihood of a value |
| Depends on dataset size | Standardizes data for fair comparisons |
| Best for counting observations | Best for comparing categories or datasets |
Example Comparison
Imagine two stores record the number of customers who buy a product.
- Store A: 40 buyers out of 100 customers (40%)
- Store B: 60 buyers out of 200 customers (30%)
Looking only at frequency, Store B appears to perform better because it has more buyers. However, relative frequency reveals that Store A actually has a higher purchase rate. This makes relative frequency a better choice when comparing datasets of different sizes.
Why Relative Frequency Is More Useful
Relative frequency removes the effect of sample size. It allows you to compare categories fairly, even when one dataset is much larger than another. This is why researchers, businesses, teachers, and statisticians often report percentages instead of raw counts.
Whether you’re analyzing survey responses, exam results, or business data, relative frequency helps you identify patterns and make more meaningful comparisons.
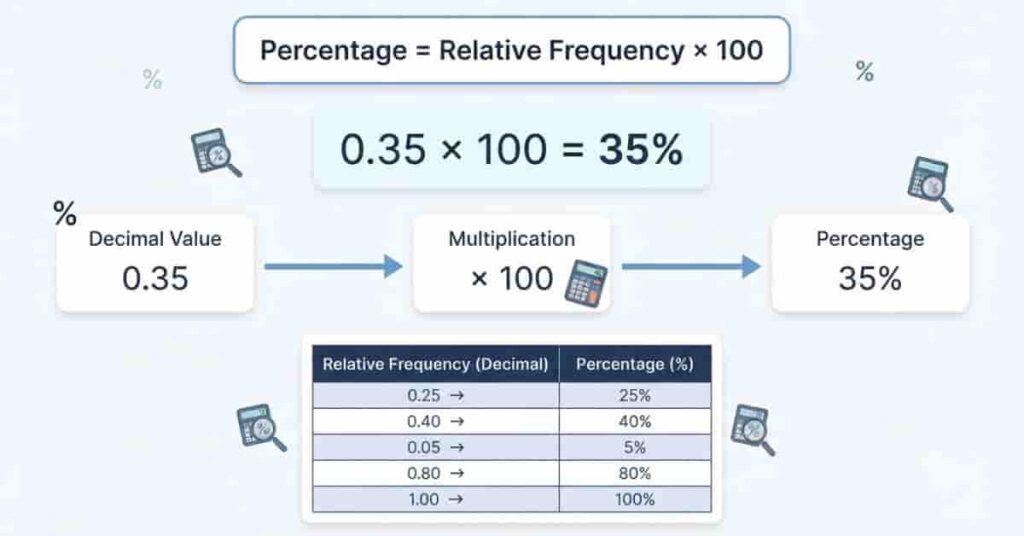
How to Convert Relative Frequency to Percentage
Relative frequency is often written as a decimal, but percentages are easier for most people to understand. Converting a relative frequency to a percentage is quick and only requires one extra step.
Formula
Percentage = Relative Frequency × 100
This formula changes a decimal into a percentage while keeping the same value. Many reports, surveys, and charts use percentages because they make comparisons more intuitive.
Worked Example
Suppose the relative frequency of students who prefer online learning is 0.45.
Multiply the relative frequency by 100:
0.45 × 100 = 45%
This means 45% of the students prefer online learning.
Here’s another example:
| Relative Frequency | Calculation | Percentage |
|---|---|---|
| 0.10 | 0.10 × 100 | 10% |
| 0.25 | 0.25 × 100 | 25% |
| 0.50 | 0.50 × 100 | 50% |
| 0.85 | 0.85 × 100 | 85% |
When Should You Use Percentages?
Percentages are usually the best choice when presenting data to others. They help readers understand results without interpreting decimal values.
Use percentages for:
- Survey results
- Business reports
- Classroom assignments
- Research summaries
- Charts and graphs
- Presentations
Decimals are still useful during calculations, but percentages make the final results easier to read and compare.
Common Mistakes When Calculating Relative Frequency
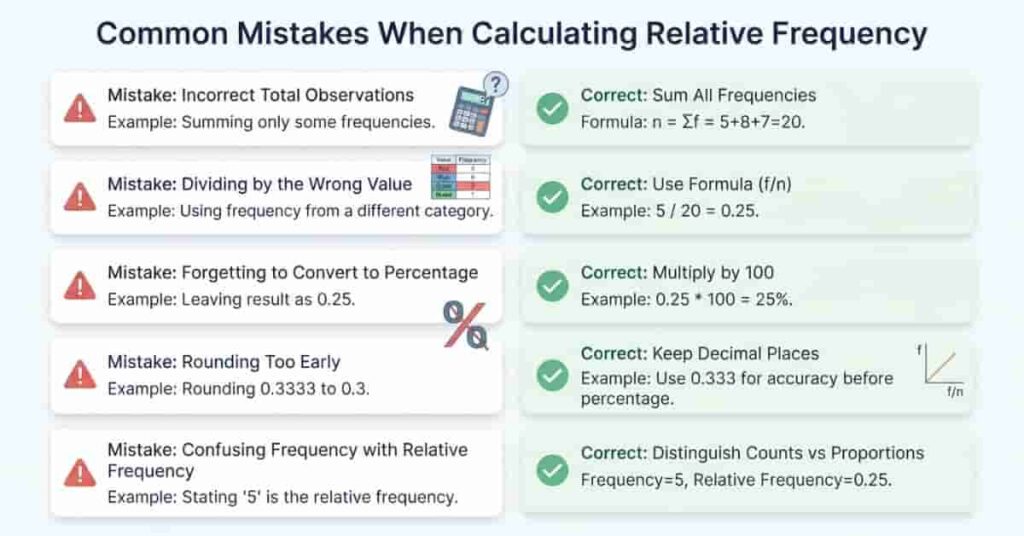
Even though relative frequency calculation is simple, small mistakes can lead to incorrect results. Knowing these common errors will help you calculate relative frequency accurately every time.
1. Using the Wrong Total Number of Observations
The denominator should always be the total number of observations in the dataset.
For example, if the frequencies add up to 50, divide by 50, not by the number of categories.
2. Dividing by the Wrong Value
Some beginners divide one frequency by another frequency instead of the total observations.
Always use this formula:
Relative Frequency = Frequency ÷ Total Number of Observations
3. Forgetting to Convert to Percentages
If your teacher or report requires percentages, remember to multiply the decimal by 100.
For example:
0.28 = 28%
4. Rounding Too Early
Avoid rounding each calculation before completing the table.
Keep extra decimal places until the final step. This helps ensure all relative frequencies total 1.00 or 100%.
5. Confusing Frequency with Relative Frequency
Frequency is a count.
Relative frequency is a proportion or percentage.
For example:
- Frequency = 15 students
- Relative Frequency = 15 ÷ 50 = 0.30 (30%)
Understanding this difference helps prevent calculation errors.
How to Use Our Relative Frequency Calculator
Calculating relative frequency by hand works well for small datasets. However, larger datasets take more time and increase the chance of mistakes. Our Relative Frequency Calculator automates the entire process and gives accurate results in seconds.
Follow these simple steps to use the calculator.
Step 1: Enter Your Data or Frequency Values
Type your raw data or enter the frequency for each value or category. Make sure the values are complete and accurate before calculating.
Step 2: Generate the Frequency Table
Click the Calculate or Generate button. The calculator creates a frequency table automatically and totals all observations.
Step 3: View Relative Frequencies Instantly
The calculator divides each frequency by the total number of observations. It displays the results as decimals and, when available, percentages.
Step 4: Copy or Export Your Results
Review your completed table, then copy or export the results for assignments, reports, presentations, or research projects.
Using the calculator saves time, reduces manual errors, and makes it easy to analyze large datasets.
Applications of Relative Frequency
Relative frequency is useful in many fields because it shows the proportion of each value instead of just the raw count. This makes data easier to compare, interpret, and present. Whether you’re studying statistics or analyzing business data, relative frequency helps you make better decisions based on percentages and proportions.
Statistics
Relative frequency helps summarize datasets and identify patterns. Statisticians use it to compare categories, create frequency distributions, and understand how data is spread across different values.
Probability
In probability, relative frequency estimates how likely an event is to occur. As more observations are collected, the relative frequency often becomes a better estimate of the event’s probability.
Research
Researchers use relative frequency to summarize study results and compare different groups. Expressing findings as percentages makes reports easier to understand and interpret.
Business Analytics
Businesses analyze customer behavior, product sales, and market trends using relative frequency. For example, a company can compare the percentage of customers who purchase different products instead of only looking at sales counts.
Survey Analysis
Survey results are usually reported as percentages. Relative frequency helps show how many respondents selected each answer, making comparisons simple and meaningful.
Education
Teachers and students use relative frequency to analyze test scores, attendance records, classroom surveys, and project results. It also helps explain statistical concepts in an easy-to-understand way.
Data Visualization
Charts and graphs become more informative when they display percentages instead of raw numbers. Relative frequency improves pie charts, bar charts, and frequency distribution graphs by showing each category’s share of the total.
Conclusion
Learning how to calculate relative frequency is easier when you follow a simple process. Count the frequency of each value, find the total number of observations, and divide each frequency by the total. You can also convert the result into a percentage for clearer comparisons. This approach helps you understand each value as a proportion of the entire dataset, making data analysis more meaningful.
If you want faster and more accurate results, try our Relative Frequency Calculator. It automatically generates relative frequencies and percentages, saving you time and reducing calculation errors. To continue building your statistics skills, explore our guides on Relative Frequency Distribution Explained and How to Calculate Relative Frequency in Excel. If you found this guide helpful, share it with others or leave a comment below with your questions or experiences. We’d love to hear from you.
Frequently Asked Questions
What is relative frequency?
Relative frequency is the proportion of times a value or category appears in a dataset. It is calculated by dividing the frequency of a value by the total number of observations. The result can be written as a decimal, fraction, or percentage, making it easier to compare data across different datasets.
How do you calculate relative frequency?
To calculate relative frequency, divide the frequency of a value by the total number of observations. For example, if a value appears 12 times in a dataset of 60 observations, the relative frequency is 12 ÷ 60 = 0.20, or 20% after converting it to a percentage.
What is the formula for relative frequency?
The standard formula is:
Relative Frequency = Frequency ÷ Total Number of Observations
This formula works for both grouped and ungrouped data. Multiply the result by 100 if you want to express it as a percentage.
How is relative frequency different from frequency?
Frequency is the number of times a value appears in a dataset. Relative frequency shows that value’s share of the total dataset. Frequency is a raw count, while relative frequency is a proportion or percentage that makes comparing data much easier.
Can relative frequency be expressed as a percentage?
Yes. Relative frequency is commonly shown as a percentage by multiplying the decimal value by 100. Percentages are easier to understand and are widely used in reports, surveys, presentations, and statistical charts.
Can relative frequency be greater than 1?
No. Relative frequency cannot be greater than 1 because it represents a proportion of the total dataset. When expressed as a percentage, it cannot exceed 100%. If your result is greater than 1, check your calculations for errors.
How is relative frequency used in probability?
Relative frequency estimates the likelihood of an event based on observed data. As the number of observations increases, the relative frequency often becomes a better estimate of the event’s true probability. This concept is widely used in experiments and statistical analysis.
Can Excel calculate relative frequency?
Yes. Microsoft Excel can calculate relative frequency using simple formulas. Divide each frequency by the total frequency using a formula such as =B2/SUM($B$2:$B$10). You can also format the results as percentages for easier interpretation.
Is there an online Relative Frequency Calculator?
Yes. An online Relative Frequency Calculator quickly calculates relative frequencies and percentages from your data. It automatically creates a frequency table, reduces manual errors, and saves time, especially when working with large datasets.
Why is relative frequency useful in statistics?
Relative frequency makes data easier to compare because it expresses each value as a proportion of the total dataset. It is widely used in statistics, probability, research, business analytics, surveys, and education to identify patterns and communicate results more clearly.

Team ClassRank builds smart, student-friendly calculators to make grade and rank tracking simple and accurate. For questions or feedback, contact us at classrankcalculator@gmail.com.

