

Table of Contents
introduction
Ever wondered if a small assignment can affect your grade in Excel?
Weighted grades in Excel confuse many because assignments have different values.
Weights decide how much each task affects your final score. Using Excel helps by accurately processing these weighted grades for schools and colleges in the USA. It reduces confusion and mistakes from manual calculations, especially with large grade sheets.
This guide will show you a simple way to solve this problem using Excel. You will learn how Excel formulas and built-in tools make grade calculations faster and more reliable. You will also avoid common errors and save time by following practical steps and using a helpful calculator.
Want to skip manual calculations?
👉 Use the Weighted Grade Calculator now and get your final grade instantly in seconds.
What Is a Weighted Grade?
A weighted grade shows how much each assignment contributes to your final score. It does not treat every task equally. Instead, it gives more importance to major exams and less to small activities. This is the core idea for calculating weighted grades in Excel for students and teachers.
Difference Between Weighted and Unweighted Grades
In an unweighted system, all scores count the same. A quiz and a final exam have equal impact. This can feel unfair in many academic systems.
In a weighted system, each category has a percentage value. That percentage decides its impact on your final grade. For example, a final exam usually carries more weight than homework.
How Weight Percentages Affect Final Grades
Weight percentages directly shape your result. Even a small change in a high-weight category can shift your final score a lot. That is why schools and colleges in the USA prefer weighted grading systems.
Common structure example:
- Assignments: 20%
- Midterm: 30%
- Final Exam: 50%
Here, the final exam has the highest impact. If you score low on it, your overall grade drops significantly. On the other hand, strong performance in the final can quickly boost your grade.
Real-Life Example of Weighted Grading
Imagine you score well in assignments but poorly in exams. Your final grade will still depend more on the midterm and final exam because they carry a higher weight.
This is where tools like Excel become useful. With weighted average grades Excel formulas, you can instantly see how each category affects your result without manual mistakes.
Weighted Grade Formula in Excel
The weighted grade formula in Excel helps you calculate a final score based on different weights. It is the key step in understanding how to calculate weighted grades in Excel without manual errors. Instead of adding all scores equally, Excel multiplies each score by its weight and then combines the results.
Basic Weighted Average Formula in Excel
The basic idea is simple. Each score is multiplied by its weight. Then all results are added together to get the final grade.
This follows a clear structure:
- Score × Weight
- Repeat for each category.
- Add all results together.
This method gives a more accurate final grade because it reflects the importance of each category.
Formula Structure Explained
In Excel, each row represents a category like assignments, midterm, or final exam. One column holds the score, and another holds the weight. Excel uses these values to calculate the final result.
For example:
- Assignments score × weight
- Midterm score × weight
- Final exam score × weight
Then Excel adds all the scores to produce the final weighted grade.
Total Weighted Score Calculation
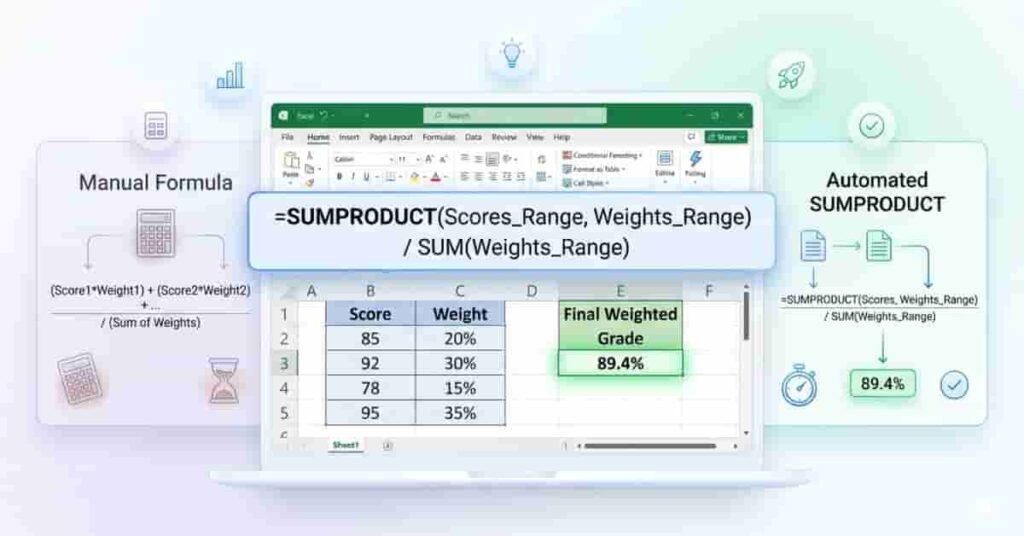
You can calculate it manually using a simple formula:
=(B2*C2)+(B3*C3)+(B4*C4)
This formula multiplies each score by its weight and sums the results.
A faster and more advanced method uses:
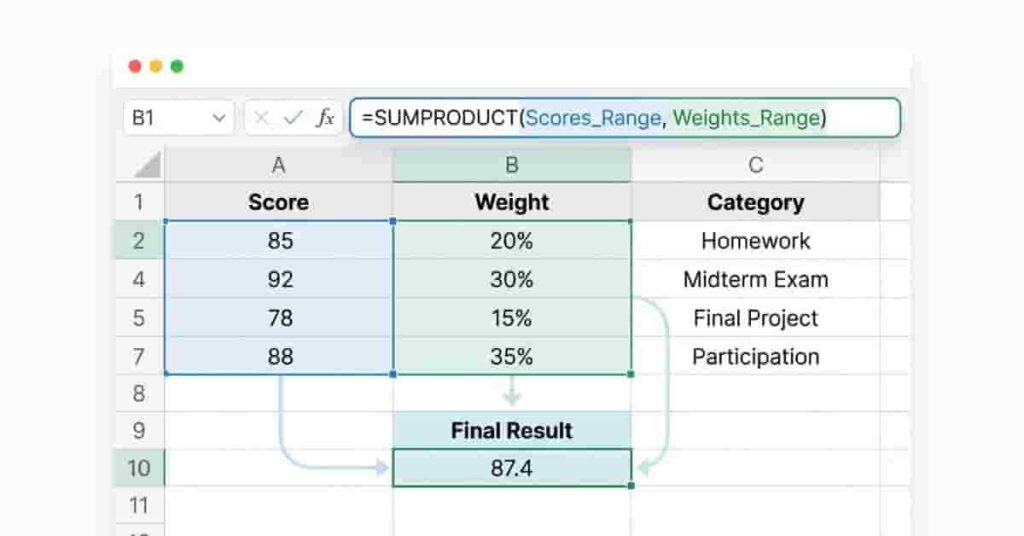
=SUMPRODUCT(B2:B4,C2:C4)
This function automatically performs all multiplications and additions in one step. It is the most efficient way to calculate weighted grades in Excel, especially when dealing with large datasets.
How to Calculate Weighted Grades in Excel (Step-by-Step)

Learning how to calculate weighted grades in Excel becomes easy when you follow a clear step-by-step method. This section breaks the process into simple actions so beginners can quickly understand how Excel handles weights and scores. You will also see how to calculate grades with weight in Excel without confusion or manual errors.
Step 1: Enter Assignment Scores
Start by opening Excel and creating three columns: Category, Score, and Weight. Enter your assignment scores in the Score column. These can include homework, quizzes, midterms, and final exams. Keep each value clean and accurate, as even small mistakes can affect the final result.
A simple structure helps you stay organized. Each row should represent one graded item. This makes it easier to apply formulas later without errors.
Step 2: Add Weight Percentages
Next, add weight percentages for each category. These percentages show how much each score contributes to your final grade. For example, homework may be 20%, midterm 30%, and final exam 50%.
Make sure all weights are clear and assigned correctly. If the weights are wrong, your final result will not be accurate.
Keep this in mind:
- Assignments = 20%
- Midterm = 30%
- Final Exam = 50%
This structure is widely used in schools and colleges in the USA.
Step 3: Convert Percentages Properly
Excel displays percentages differently if they are not formatted correctly. You must ensure weights are either in decimal form or properly formatted as percentages.
For example:
- 20% becomes 0.2
- 30% becomes 0.3
- 50% becomes 0.5
If you skip this step, your final calculation may be incorrect. This step is important if you want accurate results when learning to calculate weighted grades in Excel.
Step 4: Use the SUMPRODUCT Formula
Now comes the most important step. Use the SUMPRODUCT formula to calculate everything in one go. This method automatically multiplies scores and weights and then adds them together.
=SUMPRODUCT(B2:B4,C2:C4)
This formula saves time and removes manual calculation errors. It is the most reliable method for calculating weighted grades in Excel.
Step 5: Get Your Final Weighted Grade
After applying the formula, Excel displays your final weighted grade instantly. This result reflects your actual performance across all categories and their relative importance.
You can now easily track progress, adjust scores, or test different scenarios. This is why Excel is widely used for academic grading systems.
Once you understand this process, you can quickly repeat it for any subject or semester without starting from scratch.
Best Excel Formula for Weighted Average Grades
When calculating weighted grades in Excel, the right formula makes a big difference. The best option is the SUMPRODUCT function. It handles both multiplication and addition in a single step, saving time and reducing errors.
Why SUMPRODUCT Is the Best Choice
SUMPRODUCT is the most reliable method for weighted grades. It automatically multiplies each score by its weight and then adds all results. You do not need extra columns or complex steps.
This makes it ideal for beginners and advanced users. It also works perfectly in school and college grading systems where accuracy matters.
Faster Than Manual Multiplication
Manual methods require multiplying each value separately. Then you must add everything together. This takes time and increases the chance of mistakes.
With SUMPRODUCT, you can complete everything in a single formula. It gives instant results and keeps your spreadsheet clean and simple.
Stop guessing your grades.
Try the Weighted Grade Calculator and see how each score impacts your final result in real time.
Reduces Calculation Mistakes
Small errors in manual calculations can change your final grade. SUMPRODUCT removes this risk. It follows a structured calculation process inside Excel.
This is especially helpful when you need to calculate weighted grades in Excel for multiple subjects or students.
Works for Large Grading Sheets
SUMPRODUCT is not limited to small datasets. You can use it for large classes with many assignments. It scales easily and stays accurate even with long lists of grades.
For example:
=SUMPRODUCT(B2:B10,C2:C10)
This formula works across multiple rows and instantly calculates the final weighted average.
Example of Weighted Grade Calculation in Excel

A real example makes it much easier to understand how to calculate weighted grades in Excel. In this section, you will see a simple table, a working formula, and the final result. This will help you clearly understand how Excel combines scores and weights to produce a final grade.
Example Table Setup
First, enter your data in Excel like this:
| Homework | 85 | 20% |
| Quiz | 90 | 30% |
| Midterm | 78 | 25% |
| Final Exam | 92 | 25% |
This structure serves as the basis for calculating grades with weights in Excel. Each category has a score and a weight that shows its importance in the final grade.
Apply the Formula
Now use the SUMPRODUCT formula to calculate the final weighted grade:
=SUMPRODUCT(B2:B5,C2:C5)
This formula multiplies each score by its weight and then automatically adds all results.
Final Answer
After applying the formula, Excel returns a final weighted grade of:
86.15
Simple Explanation of the Result
This result means your overall performance is 86.15% after considering all weights. Even though your midterm score is lower, your strong quiz and final exam balance it out.
This is the power of how to calculate weighted grades in Excel. It gives a fair result based on importance, not just simple averaging.
Common Mistakes When Calculating Weighted Grades in Excel
Even when you understand how to calculate weighted grades in Excel, small mistakes can still affect your final result. These errors often look minor, but can completely change your grade. Knowing them early helps you avoid confusion and improve accuracy when calculating weighted grades in Excel.
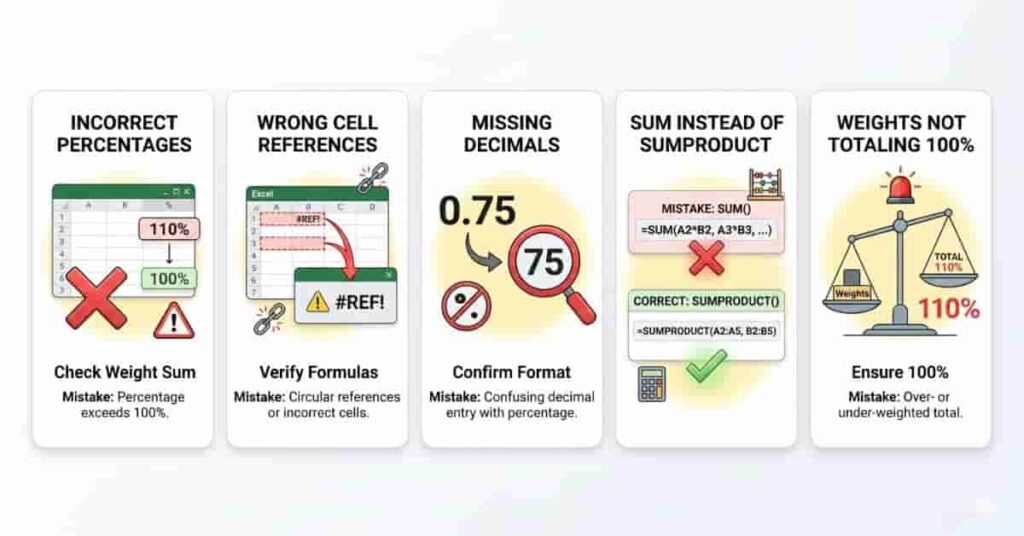
Using Whole Numbers Instead of Percentages
One of the most common mistakes is entering weights like 20, 30, and 50 instead of 20%, 30%, and 50%. Excel treats these differently. Whole numbers can give incorrect results in weighted calculations.
Always format weights as percentages or convert them into decimals. This keeps your formula accurate and consistent.
Weight Percentages Not Totaling 100%
Your weights must always add up to 100%. If they do not, your final grade will be incorrect. For example, if your total is 90% or 110%, Excel will still calculate a result, but it will not be valid.
This is a key rule for calculating weighted grades in Excel. Always double-check your totals before applying formulas.
Wrong Cell References
Another common issue is selecting the wrong range in your formula. If your scores and weights are not aligned, Excel will multiply incorrect values.
For example, B2:B5 must match C2:C5 exactly. Even a small mismatch can break your calculation.
Forgetting Decimal Formatting
If you use decimals like 0.2 instead of 20%, formatting must be correct. Many beginners forget this step, which leads to unexpected results.
Excel depends on proper formatting to calculate weighted averages correctly. Always check your number format before applying formulas.
Using SUM Instead of SUMPRODUCT
Many users mistakenly use the SUM function. However, SUM only adds values and does not multiply them by weights.
The correct function is SUMPRODUCT:
=SUMPRODUCT(B2:B5,C2:C5)
This formula is essential for calculating weighted grades in Excel because it handles both multiplication and addition in a single step.
How to Calculate Weighted Grades in Excel Automatically
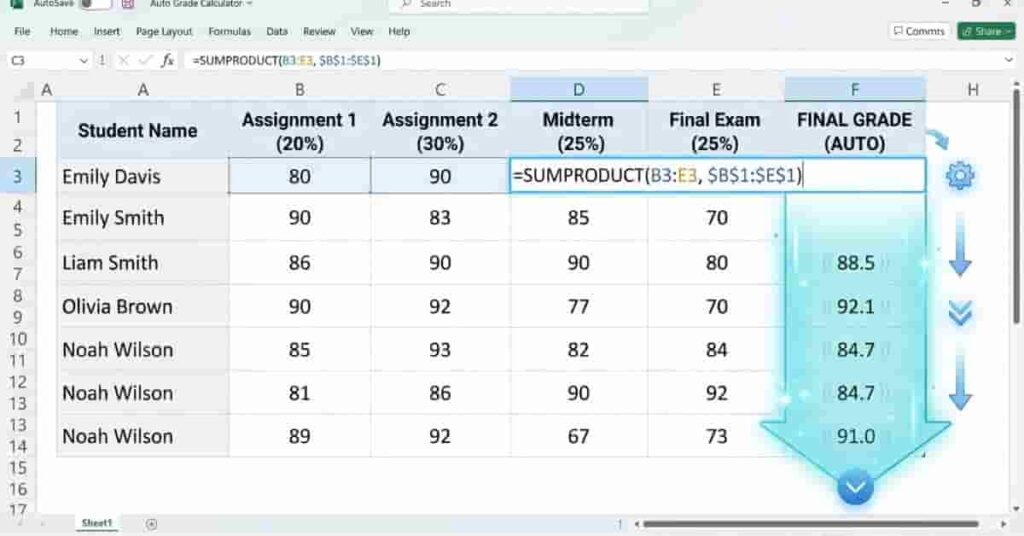
Once you understand how to calculate weighted grades in Excel, the next step is automation. Excel allows you to reuse formulas, apply them to many students, and build a dynamic grading system. This makes it easy to calculate weighted grades in Excel without repeating work for each row.
Drag Formula Feature
Excel lets you drag formulas across rows or columns. Once you write the SUMPRODUCT formula for one student, you can simply drag it down.
This saves time and ensures consistency across all calculations. It also reduces manual errors when working with multiple records.
For example, if student data is listed in rows, you only need to set the formula once. Then drag it to apply it to the entire class.
Auto-Fill for Multiple Students
Auto-fill is one of the most powerful Excel features for grading. It automatically copies your formula and adjusts cell references for each student.
This is especially useful in schools or colleges where you handle large class lists. Instead of writing formulas again and again, Excel handles everything instantly.
This method keeps your workflow fast and supports accurate weighted-grade calculations in Excel for bulk data.
Dynamic Grading Spreadsheet
A dynamic spreadsheet updates automatically when you change any score or weight. If a student improves their quiz score, the final grade updates instantly.
This makes Excel a powerful tool for real-time grade tracking. You do not need to recalculate anything manually.
You can also combine this with SUMPRODUCT to build a fully automated grading system that scales easily.
Using Templates for Faster Setup
Many users save time by using pre-made grading templates. These templates already include structured columns and formulas.
You only need to enter scores and weights. The template handles the rest.
This is a great way to speed up grade calculation with weights in Excel for teachers, students, or academic planners.
Weighted Average Grades Excel Formula vs Manual Calculation
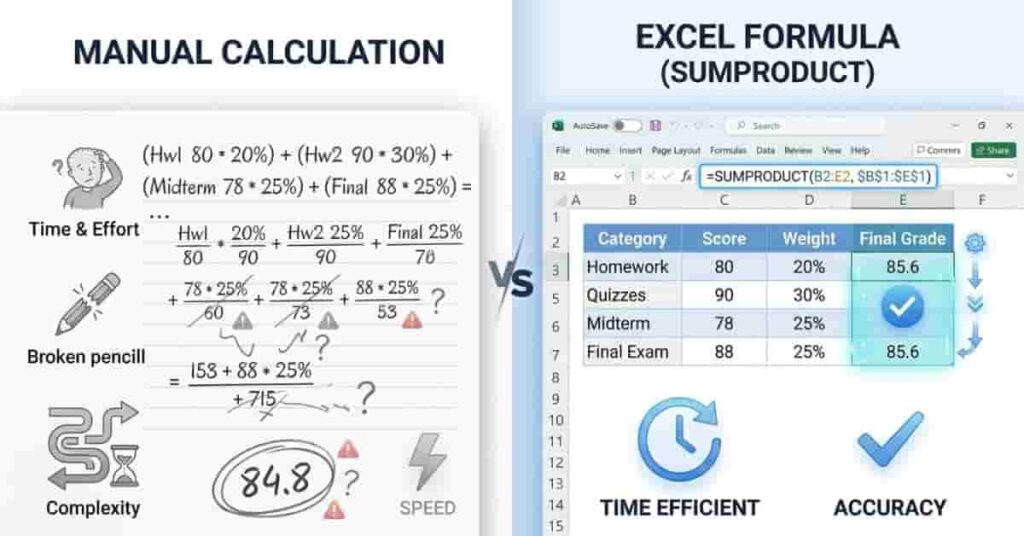
When learning how to calculate weighted grades in Excel, it is important to understand why Excel is better than manual work. Both methods produce results, but their speed, accuracy, and reliability differ significantly. This comparison shows why most students and teachers prefer Excel when calculating weighted grades.
Excel Method vs Manual Method
| Fast and automatic | Slow and time-consuming |
| Highly accurate | Prone to human errors |
| Updates instantly when values change | Needs full recalculation every time |
| Handles large datasets easily | Hard to manage with many students |
| Uses simple formulas like SUMPRODUCT | Requires multiple steps and calculations |
Why Excel Is Faster
Excel completes all calculations in seconds. You only enter your formula once, and it works for all data. This makes it ideal for students, teachers, and administrators who manage multiple grades.
Instead of repeating multiplication and addition for every student, Excel automates the entire process. This is a major advantage when calculating weighted grades in Excel for large classes.
Why Manual Calculation Is Error-Prone
Manual calculations require repeated steps. One small mistake in multiplication or addition can completely change the final grade.
It also becomes harder to manage when there are many assignments or students. Even experienced users can make mistakes under pressure.
Why Excel Updates Automatically
One of the strongest features of Excel is automatic updating. If you change a score or weight, the final grade updates instantly.
This is not possible in manual calculation. You must redo everything from the beginning.
This feature makes Excel the best tool for calculating weighted grades in real academic environments.
Tips to Make Grade Calculations Easier in Excel
If you are learning how to calculate weighted grades in Excel, small improvements can make your work much faster and cleaner. These tips help you stay organized and reduce errors when calculating weighted grades in Excel. They are simple but very powerful for students and teachers.
Use Tables for Better Organization
Excel tables keep your data structured and easy to manage. When you convert your range into a table, formulas automatically adjust when you add new rows.
This is helpful when you work with multiple students or assignments. It also keeps your grading sheet clean and readable.
Color-Code Weights for Clarity
Use colors to separate scores and weights. For example, highlight weights in blue and scores in white. This makes it easier to spot mistakes quickly.
Color coding improves visibility and reduces confusion, especially in large spreadsheets.
Freeze the Top Row
Freezing the top row keeps your headers visible as you scroll. This is useful when you have many students in your sheet.
You will always see labels like Score, Weight, and Category. This reduces the chance of entering data in the wrong column.
Use Percentage Formatting
Always format weights as percentages instead of plain numbers. For example, use 20% instead of 0.2 if possible.
This makes your spreadsheet easier to understand and reduces the risk of calculation errors. It is a key step in correctly calculating weighted grades in Excel.
Save Grading Templates
Once you build a good grading sheet, save it as a template. You can reuse it for future classes or subjects.
This saves time and ensures consistency every semester. Many teachers rely on templates to speed up grading.
Conclusion
In this guide, we explored how weighted grades work and how Excel simplifies the entire process. You learned formulas, step-by-step methods, examples, and common mistakes to avoid.
Using how to calculate weighted grades in Excel makes grading faster, more accurate, and much easier for beginners. Excel removes manual effort and reduces errors with simple tools like SUMPRODUCT. It also helps you understand how each score impacts your final grade.
Overall, Excel is the most efficient way to handle weighted grading systems. The weighted-average grades Excel method provides clear, reliable results in seconds.
Try using a ready-made calculator or template to practice what you learned today. Share this guide with classmates or teachers, and explore more Excel tutorials on the website to improve your grading skills further.
Team ClassRank builds smart, student-friendly calculators to make grade and rank tracking simple and accurate. For questions or feedback, contact us at classrankcalculator@gmail.com.